Spring has come and gone. Where has the time gone? Probably all those late nights spent at the youth ballpark. The average spring (March–May) temperature in Indiana was 55.9°F, which was 4°F above the 1991–2020 normal. That tied spring 2026 with spring 2024 as the third-warmest spring on record statewide. March and April did most of the heavy lifting, with both months finishing well above normal. May, on the other hand, was 2°F below normal. Such a slacker, right? The month got off to a chilly start. On May 3, the National Weather Service Cooperative Observer station at Kokomo 3 WSW recorded a low of 26°F, tying the station’s record-low May temperature previously observed on May 9 and 10, 2020 (records date back to 1901). Fortunately, the cold snap didn’t stick around, and temperatures gradually moderated through the rest of the month. June has been much less dramatic—at least when it comes to temperatures. We’ll get to the severe weather in a moment. Through June 23, the statewide average temperature was 70.6°F, just 0.1°F above normal. In other words, temperatures have been about as normal as they can get.
One way climatologists and agronomists track crop progress is through Modified Growing Degree Days (MGDDs), a measure of accumulated heat available for crop growth and development. Because corn development is closely tied to temperature, MGDDs provide a useful way to assess how the growing season is progressing compared to normal. So, how have heat accumulations responded to this spring’s temperature swings? From May 1 through June 23, accumulated MGDDs ranged from around 690 units in northern Indiana to more than 1,000 units in southern portions of the state (Figure 1). Compared to the 1991–2020 climatological normal, MGDD accumulations range from near normal to more than 80 units below normal across Indiana. Expressed another way, most locations have accumulated between 75% and 100% of their typical MGDD total for this point in the growing season.
It has been a stormy and soggy June for many locations across Indiana. Through June 24, precipitation totals have ranged from around 2 inches to a whopping 13 inches (Figure 2). Yes, you read that correctly—13 inches. A Community Collaborative Rain, Hail & Snow Network (CoCoRaHS) station at Dyer 1.0 WNW in Lake County has measured exactly 13.00 inches of precipitation this month. More than 2.5 inches of that fell on June 12 alone. The station is already running 9.05 inches above normal for June, more than three times its typical June rainfall. Not everyone has been invited to June’s rain party, though. Portions of southeastern Indiana, including Jackson, Scott, and Jefferson Counties, remain 1–3 inches below normal for the month. Farther southwest, parts of Posey County are also running 1–2 inches behind normal. A quick note on severe weather—and a continued tip of the cap to Indiana’s National Weather Service offices, whose timely forecasts and warnings have helped keep Hoosiers informed during an active season. Through June 24, Indiana recorded 52 preliminary tornadoes in 2026, nearly twice the state’s 1996–2025 annual average of 28 tornadoes.
Looking ahead, active weather is expected to continue through the end of June, with the heaviest rainfall forecast south of Interstate 70. An additional 2–4 inches of rain is possible there (Figure 3), while northern Indiana could still pick up as much as 2 inches. Temperatures are also expected to turn decidedly warmer through the first week of July, with a greater than 60% chance of excessive heat around the Independence Day holiday (Figure 4). Summer finally looks ready to settle in.
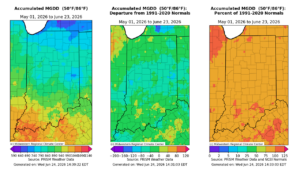
Figure 1. May 1- June 23, 2026, MGDD maps (left: total MGDD accumulation; center: departure from 1991–2020 normals; right: percent of 1991–2020 normal).
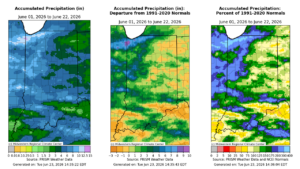
Figure 2. June 1-22, 2026, precipitation across Indiana (left: total precipitation accumulation; center: departure from 1991–2020 normals; right: percent of 1991–2020 normal precipitation).
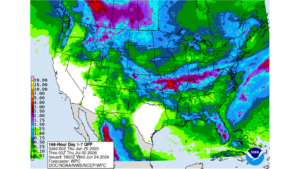
Figure 3. 8:00 PM EDT June 24 – 8:00 PM July 1 Weather Prediction Center quantitative precipitation forecast.
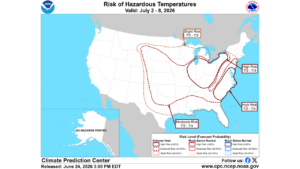
Figure 4. Climate Prediction Center’s Risk of Hazardous Temperatures for July 2 – 8, 2026.