Dry Conditions Continue, Drought Conditions Expected to Worsen – Vegetable Crops Hotline

Dry Conditions Continue, Drought Conditions Expected to Worsen

Temperatures warmed into the 80s by the end of Memorial Day weekend, but low dew point temperatures made the heat bearable. The air felt dry, and any time I would stand up from my lawn chair, I would be shocked by static electricity. The state average temperature between May 1 and May 30 was 62.3F, which was 0.5F above the 1991-2020 climatological normal (Figure 1). Climate Divisions in the northwest and southwest experienced the largest temperature departures this week (0.9F and 1.0F respectively). Accumulated Modified Growing Degree Days, between April 1 and May 30, ranged from 360 to 800 units across the state (Figure 2). Northwestern Indiana continued to run above normal and southeastern Indiana remained below normal for the period. Cooler temperatures in April and the beginning of May were to blame.

Figure 1. Indiana climate division and state temperature, normal temperature, temperature departure from normal, precipitation, normal precipitation, precipitation departure from normal, and percent of mean precipitation for May 1-30, 2023.

Figure 1. Indiana climate division and state temperature, normal temperature, temperature departure from normal, precipitation, normal precipitation, precipitation departure from normal, and percent of mean precipitation for May 1-30, 2023.

Figure 2. Total Accumulated Indiana Modified Growing Degree Days (MGDDs) April 1-May 30, 2023 (left) and Total Accumulated MGDDs represented as the departure from the 1991-2020 climatological normal (right).

Figure 2. Total Accumulated Indiana Modified Growing Degree Days (MGDDs) April 1-May 30, 2023 (left) and Total Accumulated MGDDs represented as the departure from the 1991-2020 climatological normal (right).

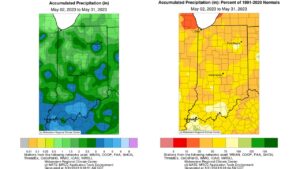
The spigot turned off over the last seven days, which worsened the below-normal precipitation trend for the month. The entire state averaged 2.52 inches of rain from May 1 to May 30 (1.17 inches below normal) (Figure 1). Climate Division 9, located in southeast Indiana, was the driest (2.09 inches below normal). Most of the state averaged between 25-75 percent of normal since the beginning of the month (Figure 3). Dormant lawns, lowering water levels, and reduced streamflows have been reported across a large portion of the state. Jeff Burbrink, Elkhart County Extension Educator, indicated that his pond level dropped eight inches over a stretch of ten days.

Figure 3. Interpolated map displaying accumulated precipitation for May 2-May 31, 2023 (left). Interpolated map displaying accumulated precipitation as a percent of the 1991-2020 climatological normal (right).

Figure 3. Interpolated map displaying accumulated precipitation for May 2-May 31, 2023 (left). Interpolated map displaying accumulated precipitation as a percent of the 1991-2020 climatological normal (right).

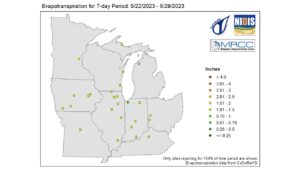
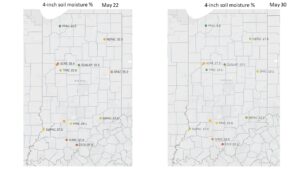
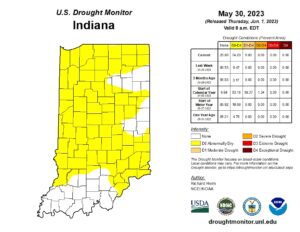
CoCoRaHS is a volunteer precipitation observation network and also has observers measuring evapotranspiration. Data between May 22 and May 29 indicated that ET rates ranged from 1 to 2 inches, which is fairly significant when we do not get rain. These ET rates can be viewed on the MRCC Drought Information page (Figure 4). Significant water loss can also be seen in the Purdue Mesonet four-inch soil moisture observations (Figure 5). Volumetric water content fell by more than 5 to 15 percent over the last week, which is why we are seeing things change quickly across the state. The two good things: 1) crops are building stronger root systems as they dig deeper to find moisture; and 2) weather has been perfect for making hay. Recent replanted crops may have issues finding moisture, so keep an eye on emergence in those areas. In response to the dryness, the June 1 US Drought Monitor (Figure 6) expanded abnormally dry conditions throughout much of the state, and we expect to see additional degradation given the forecast.

Figure 4. CoCoRaHS Evapotranspiration for 7-day period: May 22-29, 2023, which can be obtained from the MRCC Drought Information page.

Figure 4. CoCoRaHS Evapotranspiration for 7-day period: May 22-29, 2023, which can be obtained from the MRCC Drought Information page.

Figure 5. May 22 (left) and May 30 (right) Purdue Mesonet 4-inch soil moisture (volumetric water content) represented as a percentage. Data can be obtained by the Purdue Mesonet Data Hub.

Figure 5. May 22 (left) and May 30 (right) Purdue Mesonet 4-inch soil moisture (volumetric water content) represented as a percentage. Data can be obtained by the Purdue Mesonet Data Hub.

Figure 6. June 1, 2023, US Drought Monitor. The US Drought Monitor is released every Thursday morning by 8:30 AM.

Figure 6. June 1, 2023, US Drought Monitor. The US Drought Monitor is released every Thursday morning by 8:30 AM.

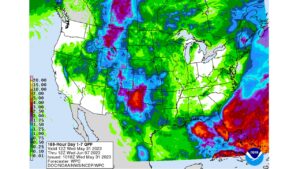
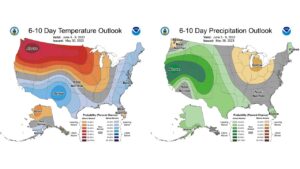
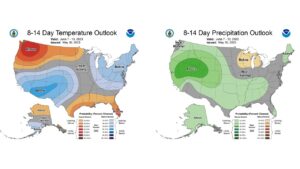
Very isolated, convective precipitation was observed on May 30 and May 31, but did not resolve any of the broader drought impacts. The 7-day forecast, valid through June 7, does not show widespread precipitation across the state (Figure 7). Overall, precipitation will remain below normal, coupled with air temperatures in the upper 80s and low 90s. Paired with this, dew point temperatures are expected to drop into the 40s and, in some spots, the 30s. The 6-to-10-day climate outlook from the Climate Prediction Center has elevated chances for above-normal temperatures and below-normal precipitation through June 9 (Figure 8). The 8-14-day outlook depicts a cool down with a return to near normal precipitation (Figure 9). Breaking dry patterns is historically difficult, so we will see how long these drying conditions persist. Stay tuned.
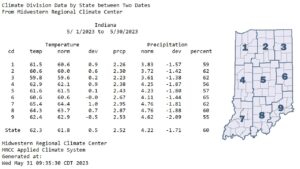
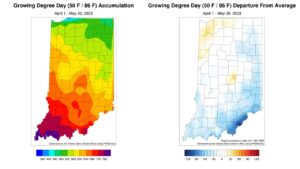
Figure 7. NWS Weather Prediction Center 7-day quantitative precipitation forecast for the continental United States, valid May 31-June 7, 2023.

Figure 7. NWS Weather Prediction Center 7-day quantitative precipitation forecast for the continental United States, valid May 31-June 7, 2023.

Figure 8. The CPC’s 6–10-day temperature and precipitation outlooks, valid for June 5 through June 9, 2023.

Figure 8. The CPC’s 6–10-day temperature and precipitation outlooks, valid for June 5 through June 9, 2023.

Figure 9. The CPC’s 8–14-day temperature and precipitation outlooks, valid for June 7 through June 13, 2023.

Figure 9. The CPC’s 8–14-day temperature and precipitation outlooks, valid for June 7 through June 13, 2023.

Share This Article
It is the policy of the Purdue University that all persons have equal opportunity and access to its educational programs, services, activities, and facilities without regard to race, religion, color, sex, age, national origin or ancestry, marital status, parental status, sexual orientation, disability or status as a veteran. Purdue is an Affirmative Action Institution. This material may be available in alternative formats. 1-888-EXT-INFO Disclaimer: Reference to products in this publication is not intended to be an endorsement to the exclusion of others which may have similar uses. Any person using products listed in this publication assumes full responsibility for their use in accordance with current directions of the manufacturer.
Vegetable Crops Hotline - Horticulture & Landscape Architecture, 625 Agriculture Mall, West Lafayette, IN 47907

© 2024 Purdue University | An equal access/equal opportunity university | Copyright Complaints | Maintained by Vegetable Crops Hotline

If you have trouble accessing this page because of a disability, please contact Vegetable Crops Hotline at plangenh@purdue.edu | Accessibility Resources