The heat and humidity have returned to the state, as heat indices soared above 100°F on Wednesday and Thursday (July 23-24) this week. The National Weather Service issued heat advisories that spanned from northeast Texas to northeast Ohio on July 24. Over the last 7-day period (July 16-22), average temperatures ranged from near normal in northern Indiana to 2-4°F above normal in southern Indiana (Figure 1). Maximum temperatures were near normal in the south to 2-4°F below normal in the northern half of the state (Figure 2). Minimum temperature departures were more notable, as temperatures ranged from 1 to 6°F above normal statewide (Figure 3).
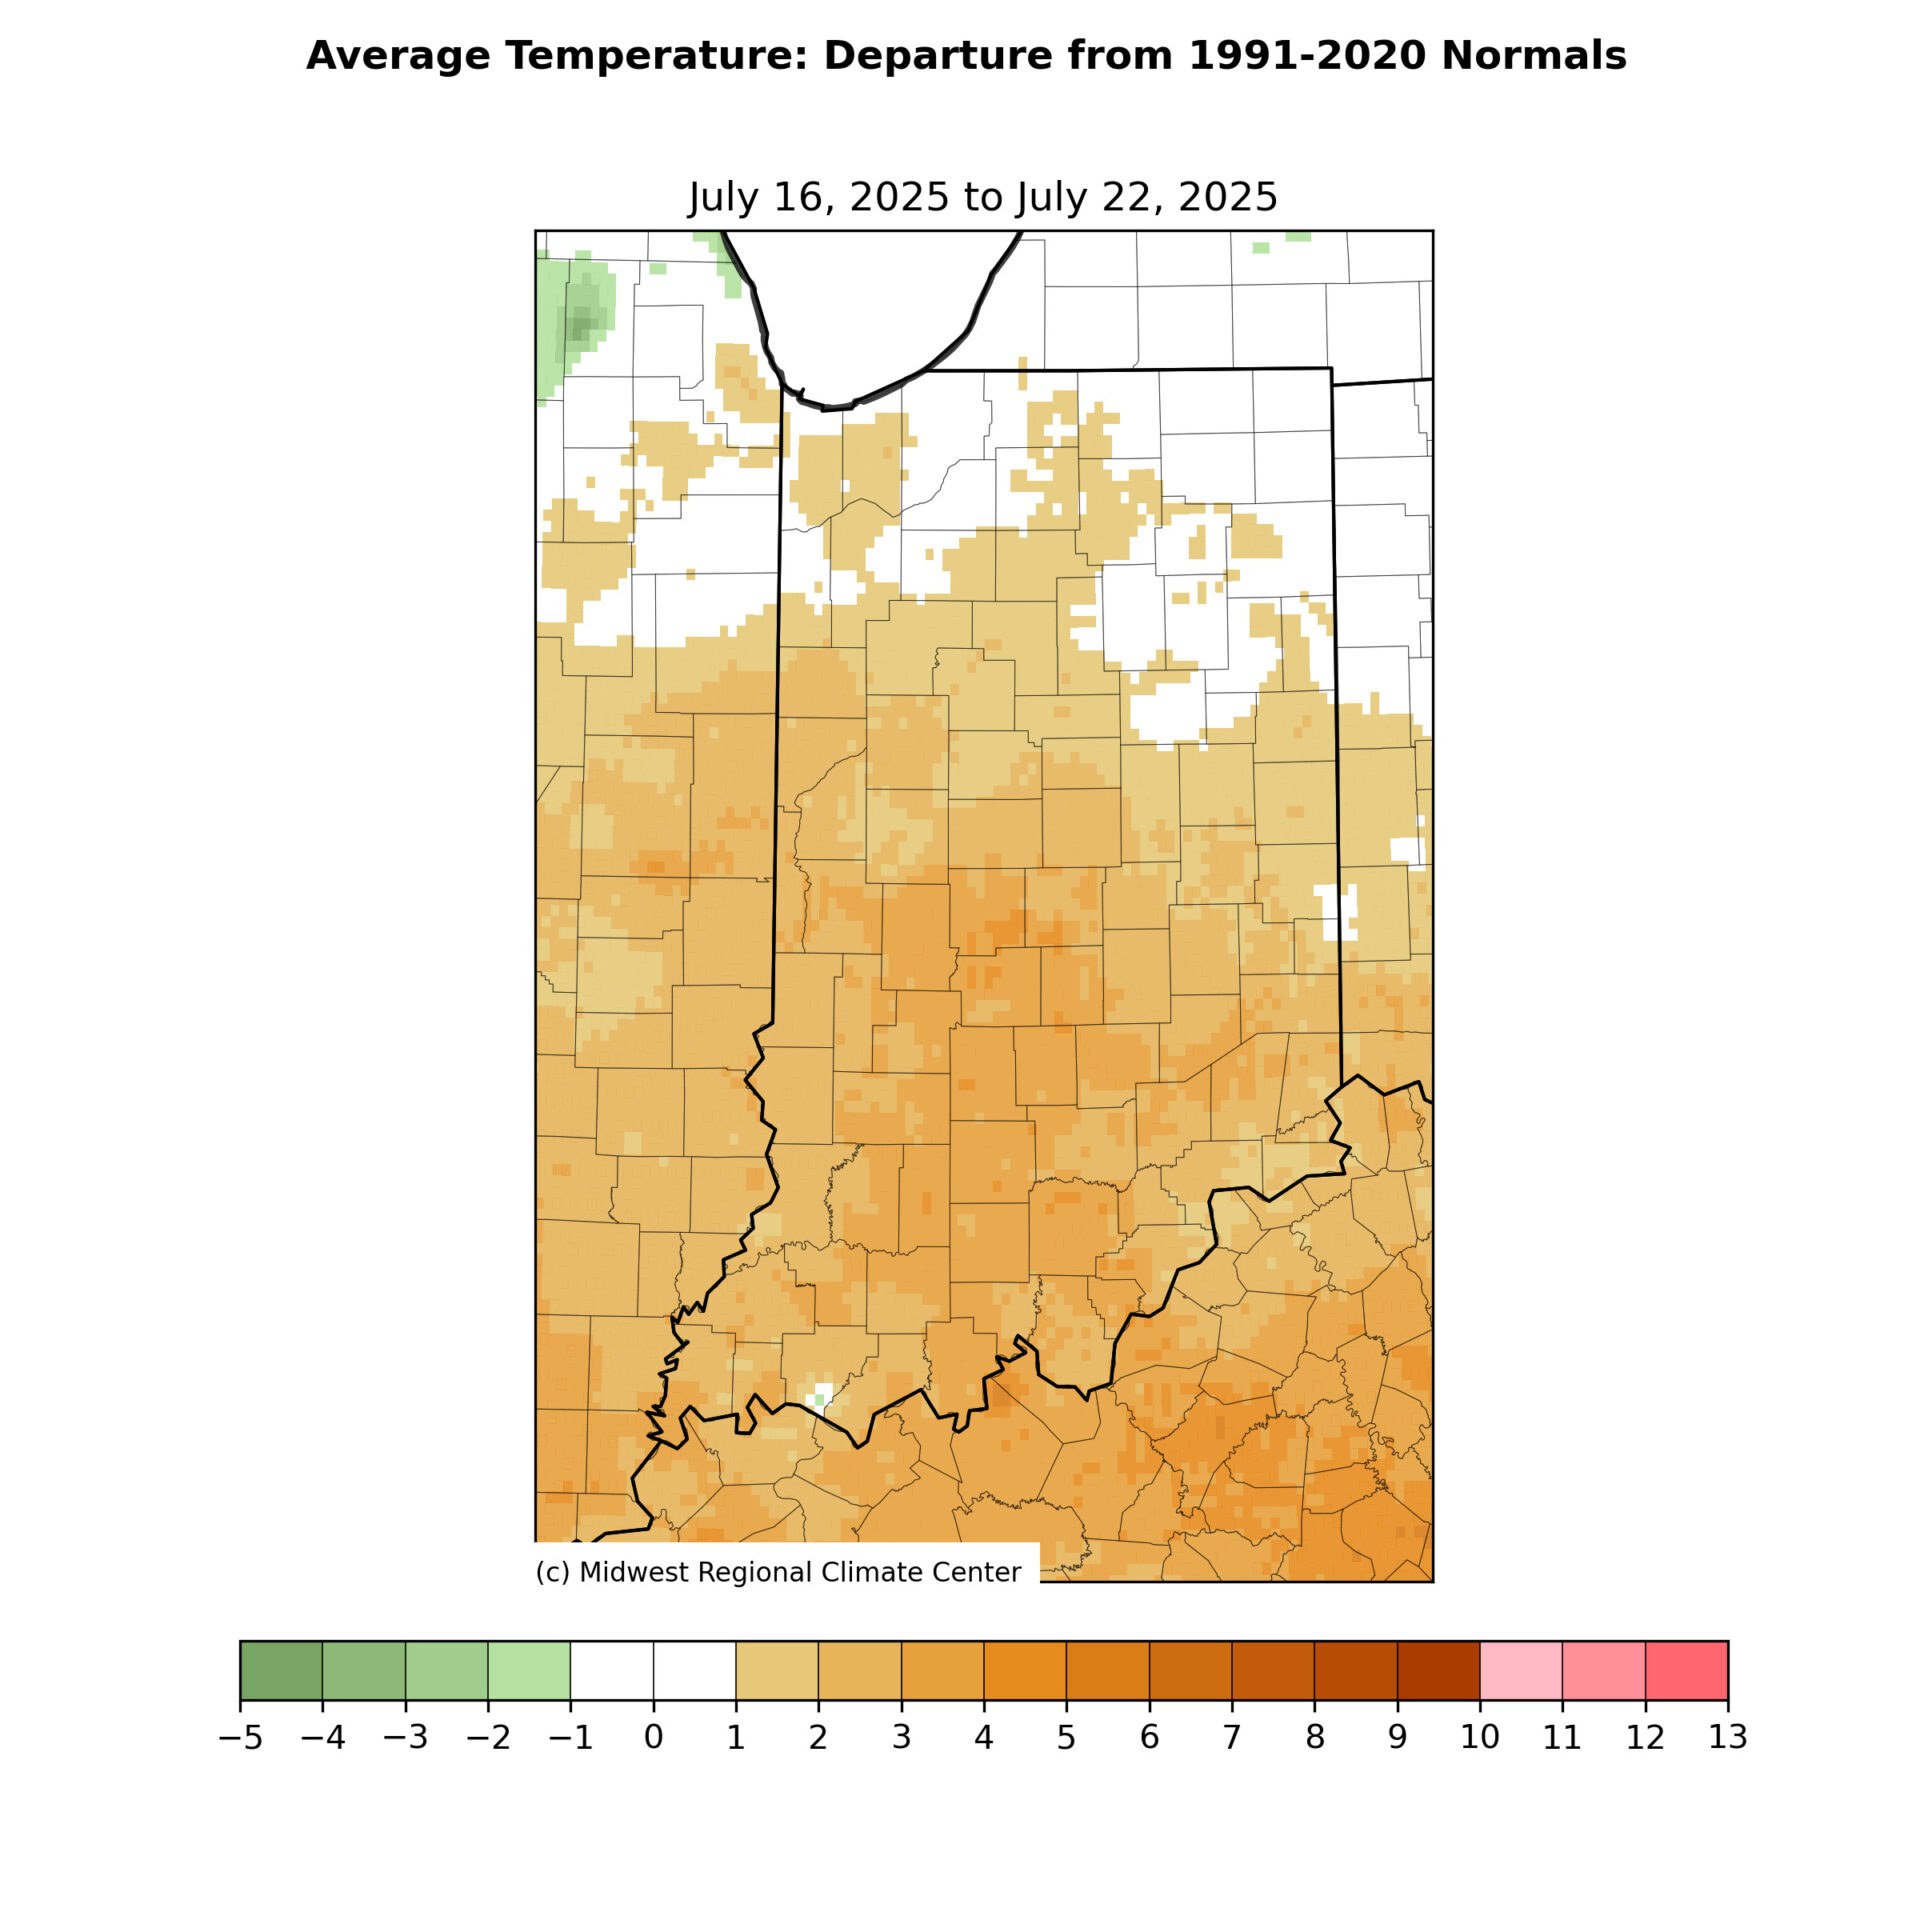
Figure 1. July 16-22 Mean Temperature departure from the 1991-2020 normal.
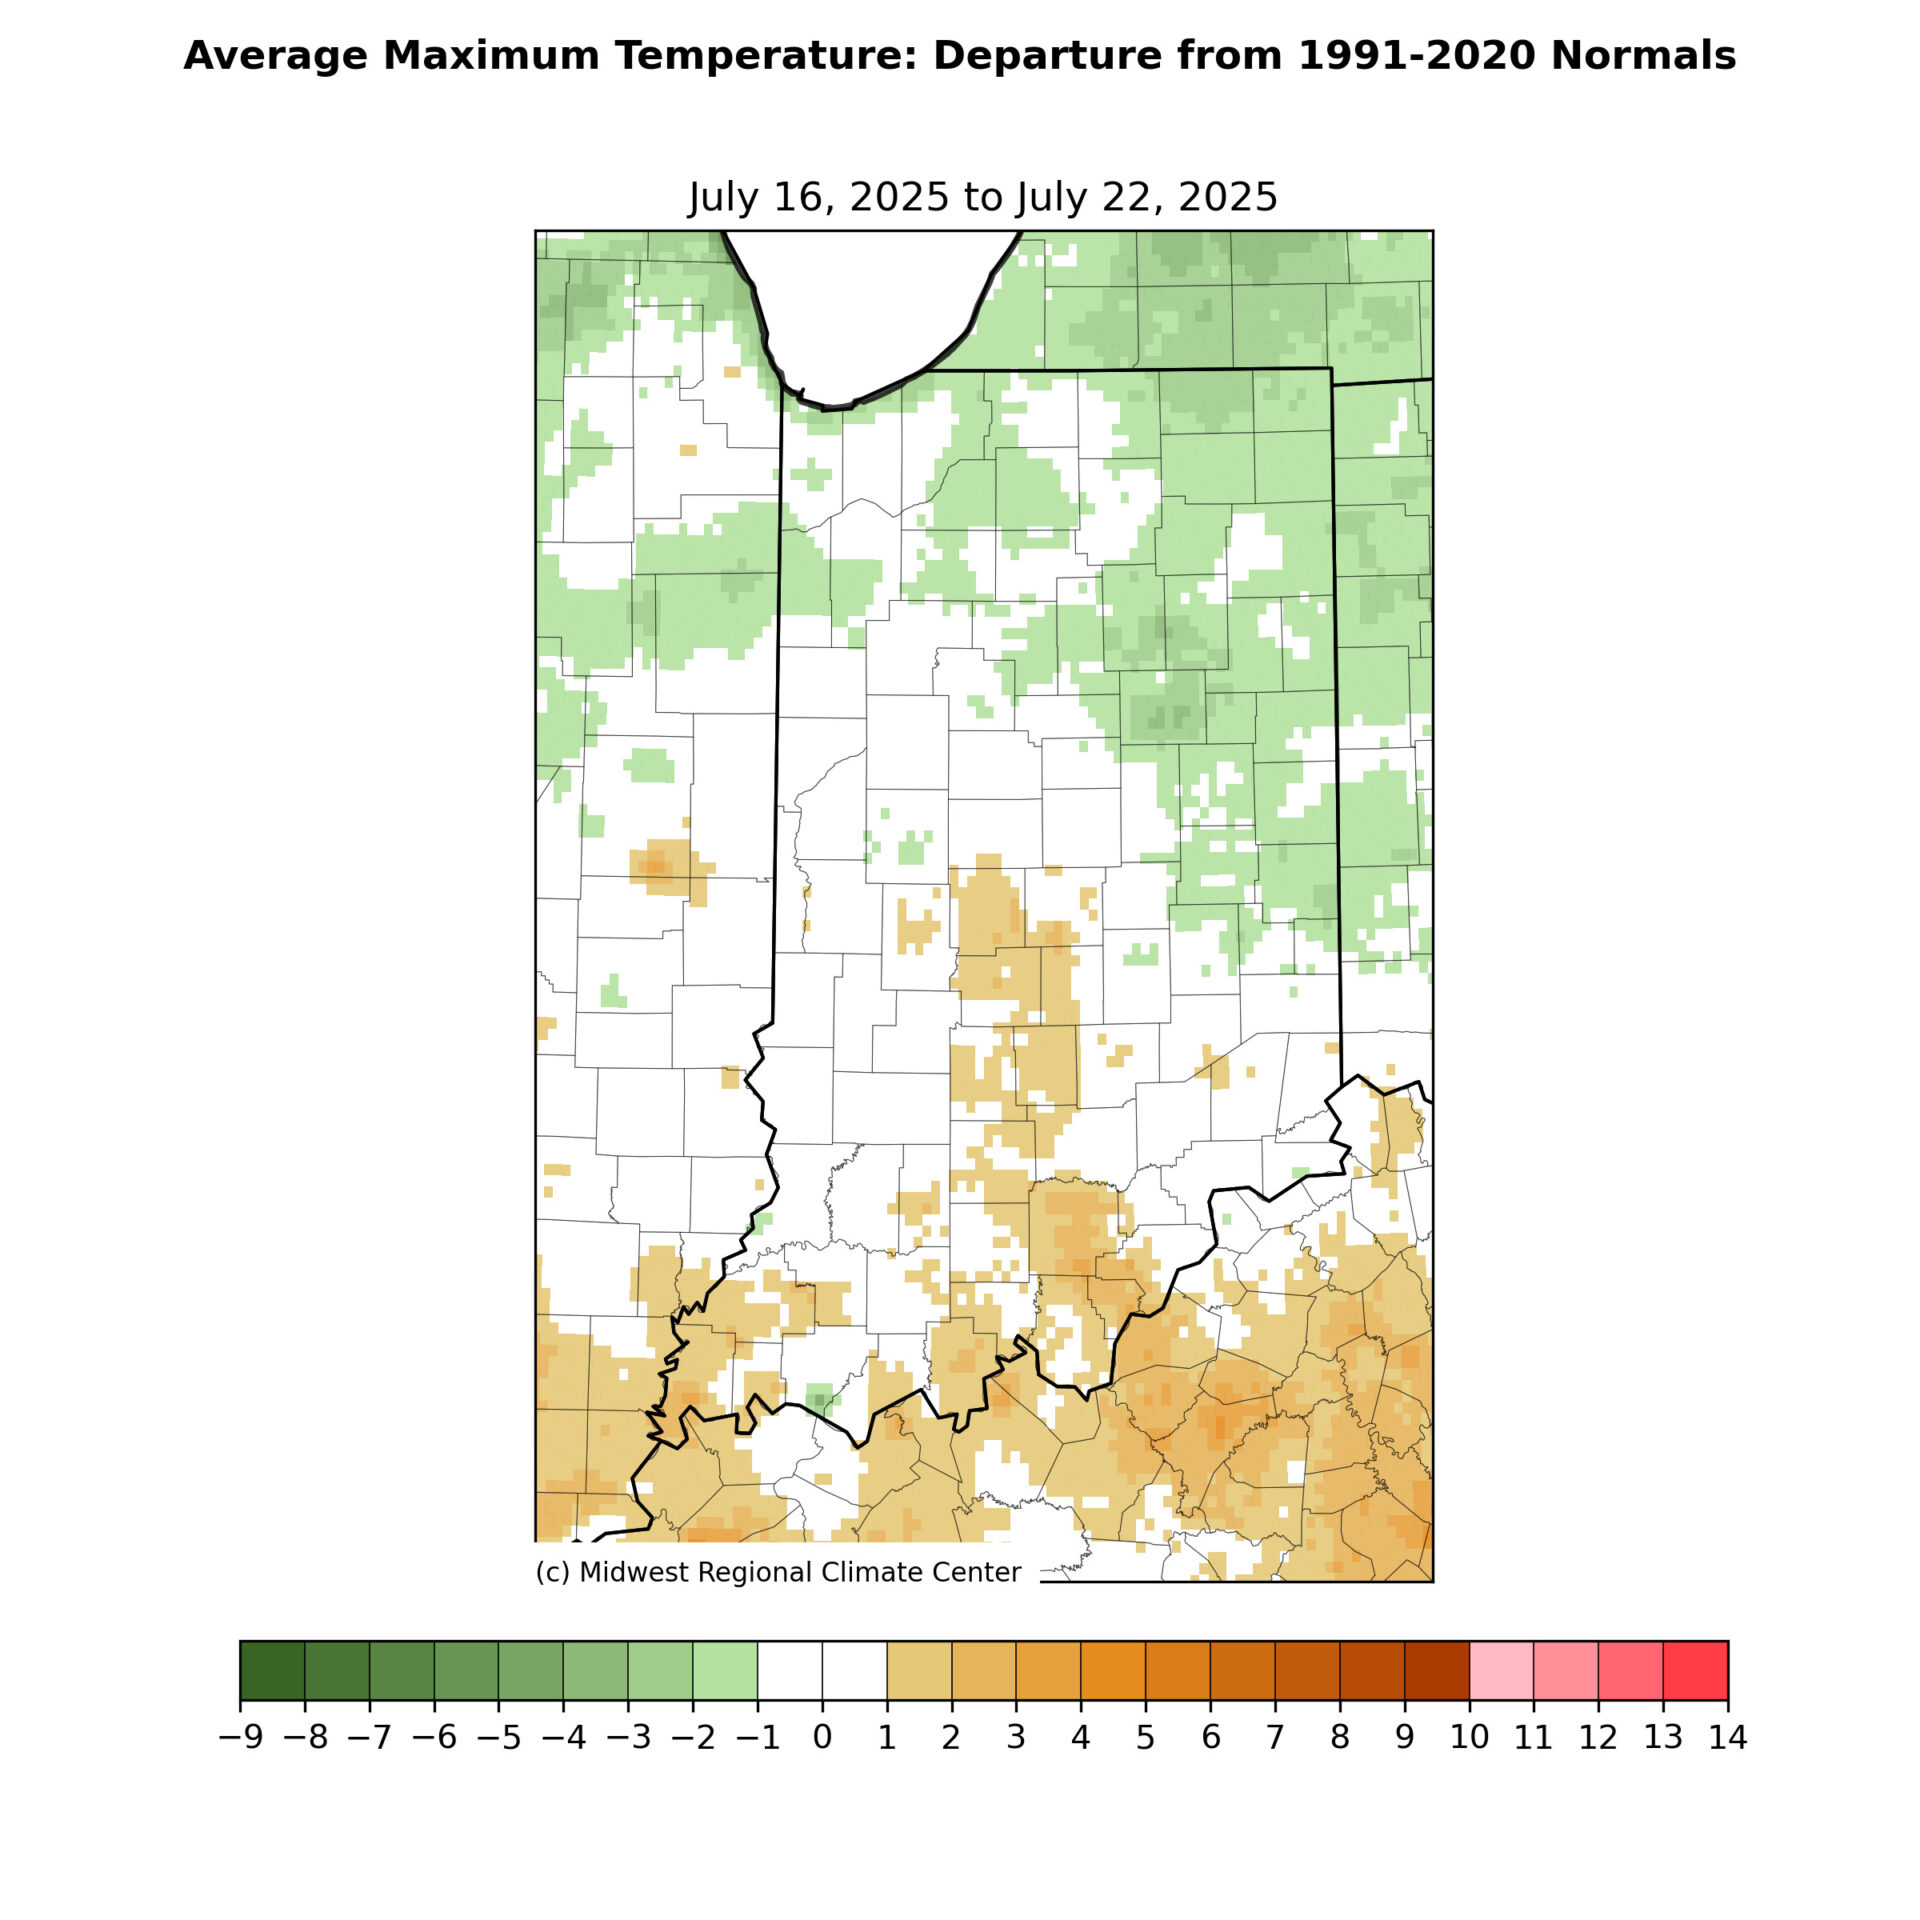
Figure 2. July 16-22 Max Temperature departure from the 1991-2020 normal.
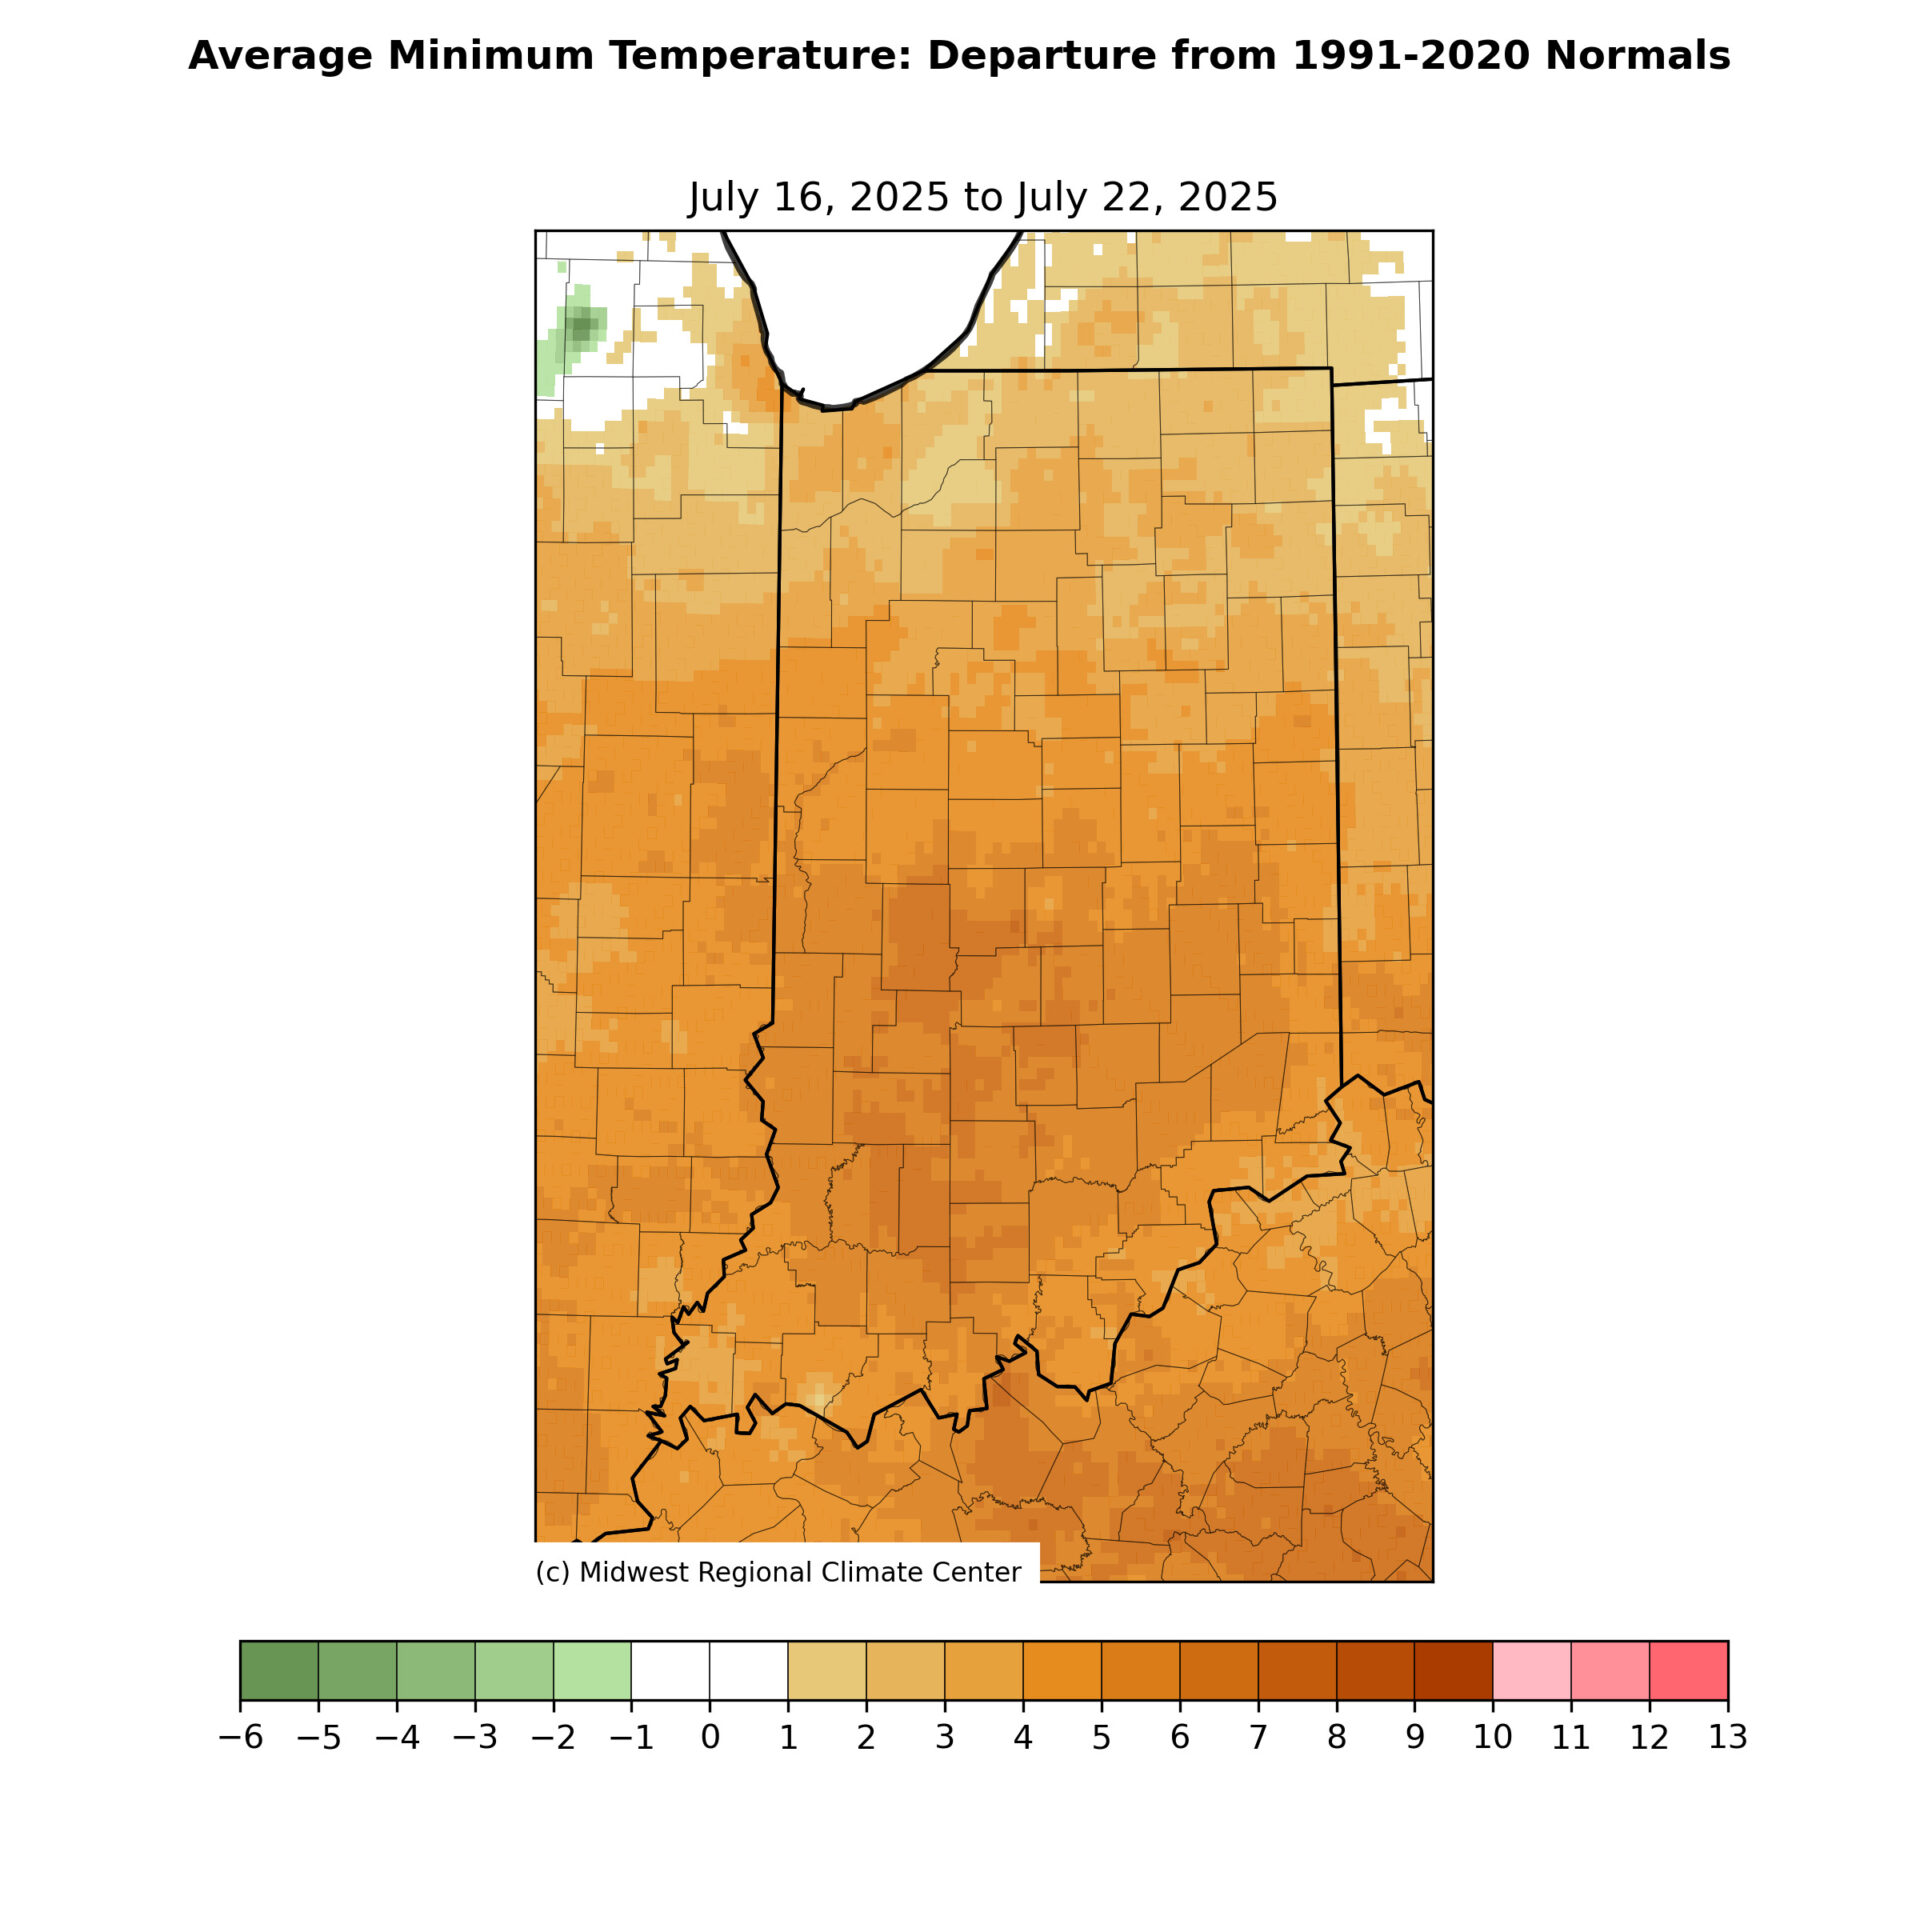
Figure 3. July 16-22 Min Temperature departure from the 1991-2020 normal.
Notice anything different with these maps? The Midwestern Regional Climate Center (MRCC) released new gridded maps this week, sourced from PRISM datasets and the NCEI 1991-2020 Normals dataset. Regional maps are now accessible on the MRCC’s Midwest Climate Watch and Ag Climate Dashboard, while Indiana maps can be obtained from the Indiana State Climate Office. The high-resolution grids enable us to see more detailed map features, helping us identify hotspots for temperatures and precipitation. Speaking of precipitation…
Southern Indiana received the highest rainfall totals from July 16 to 22, with areas measuring between 6 and 9 inches (Figure 4). Mitchell 2.1 N, located in Lawrence County, recorded 9.12 inches during these 7 days. Francisco 0.1 SE, in Gibson County, reported 6.57 inches over the same span. During the previous 30-day period (June 23-July 22), northern Indiana experienced areas with less than 50 percent of normal rainfall, and in some cases, less than 25 percent of normal rainfall in parts of Allen County (Figure 5). Most of southern Indiana has received between 150% and 300% of normal rainfall over the past 30 days, with a significant portion falling between July 16 and 22.
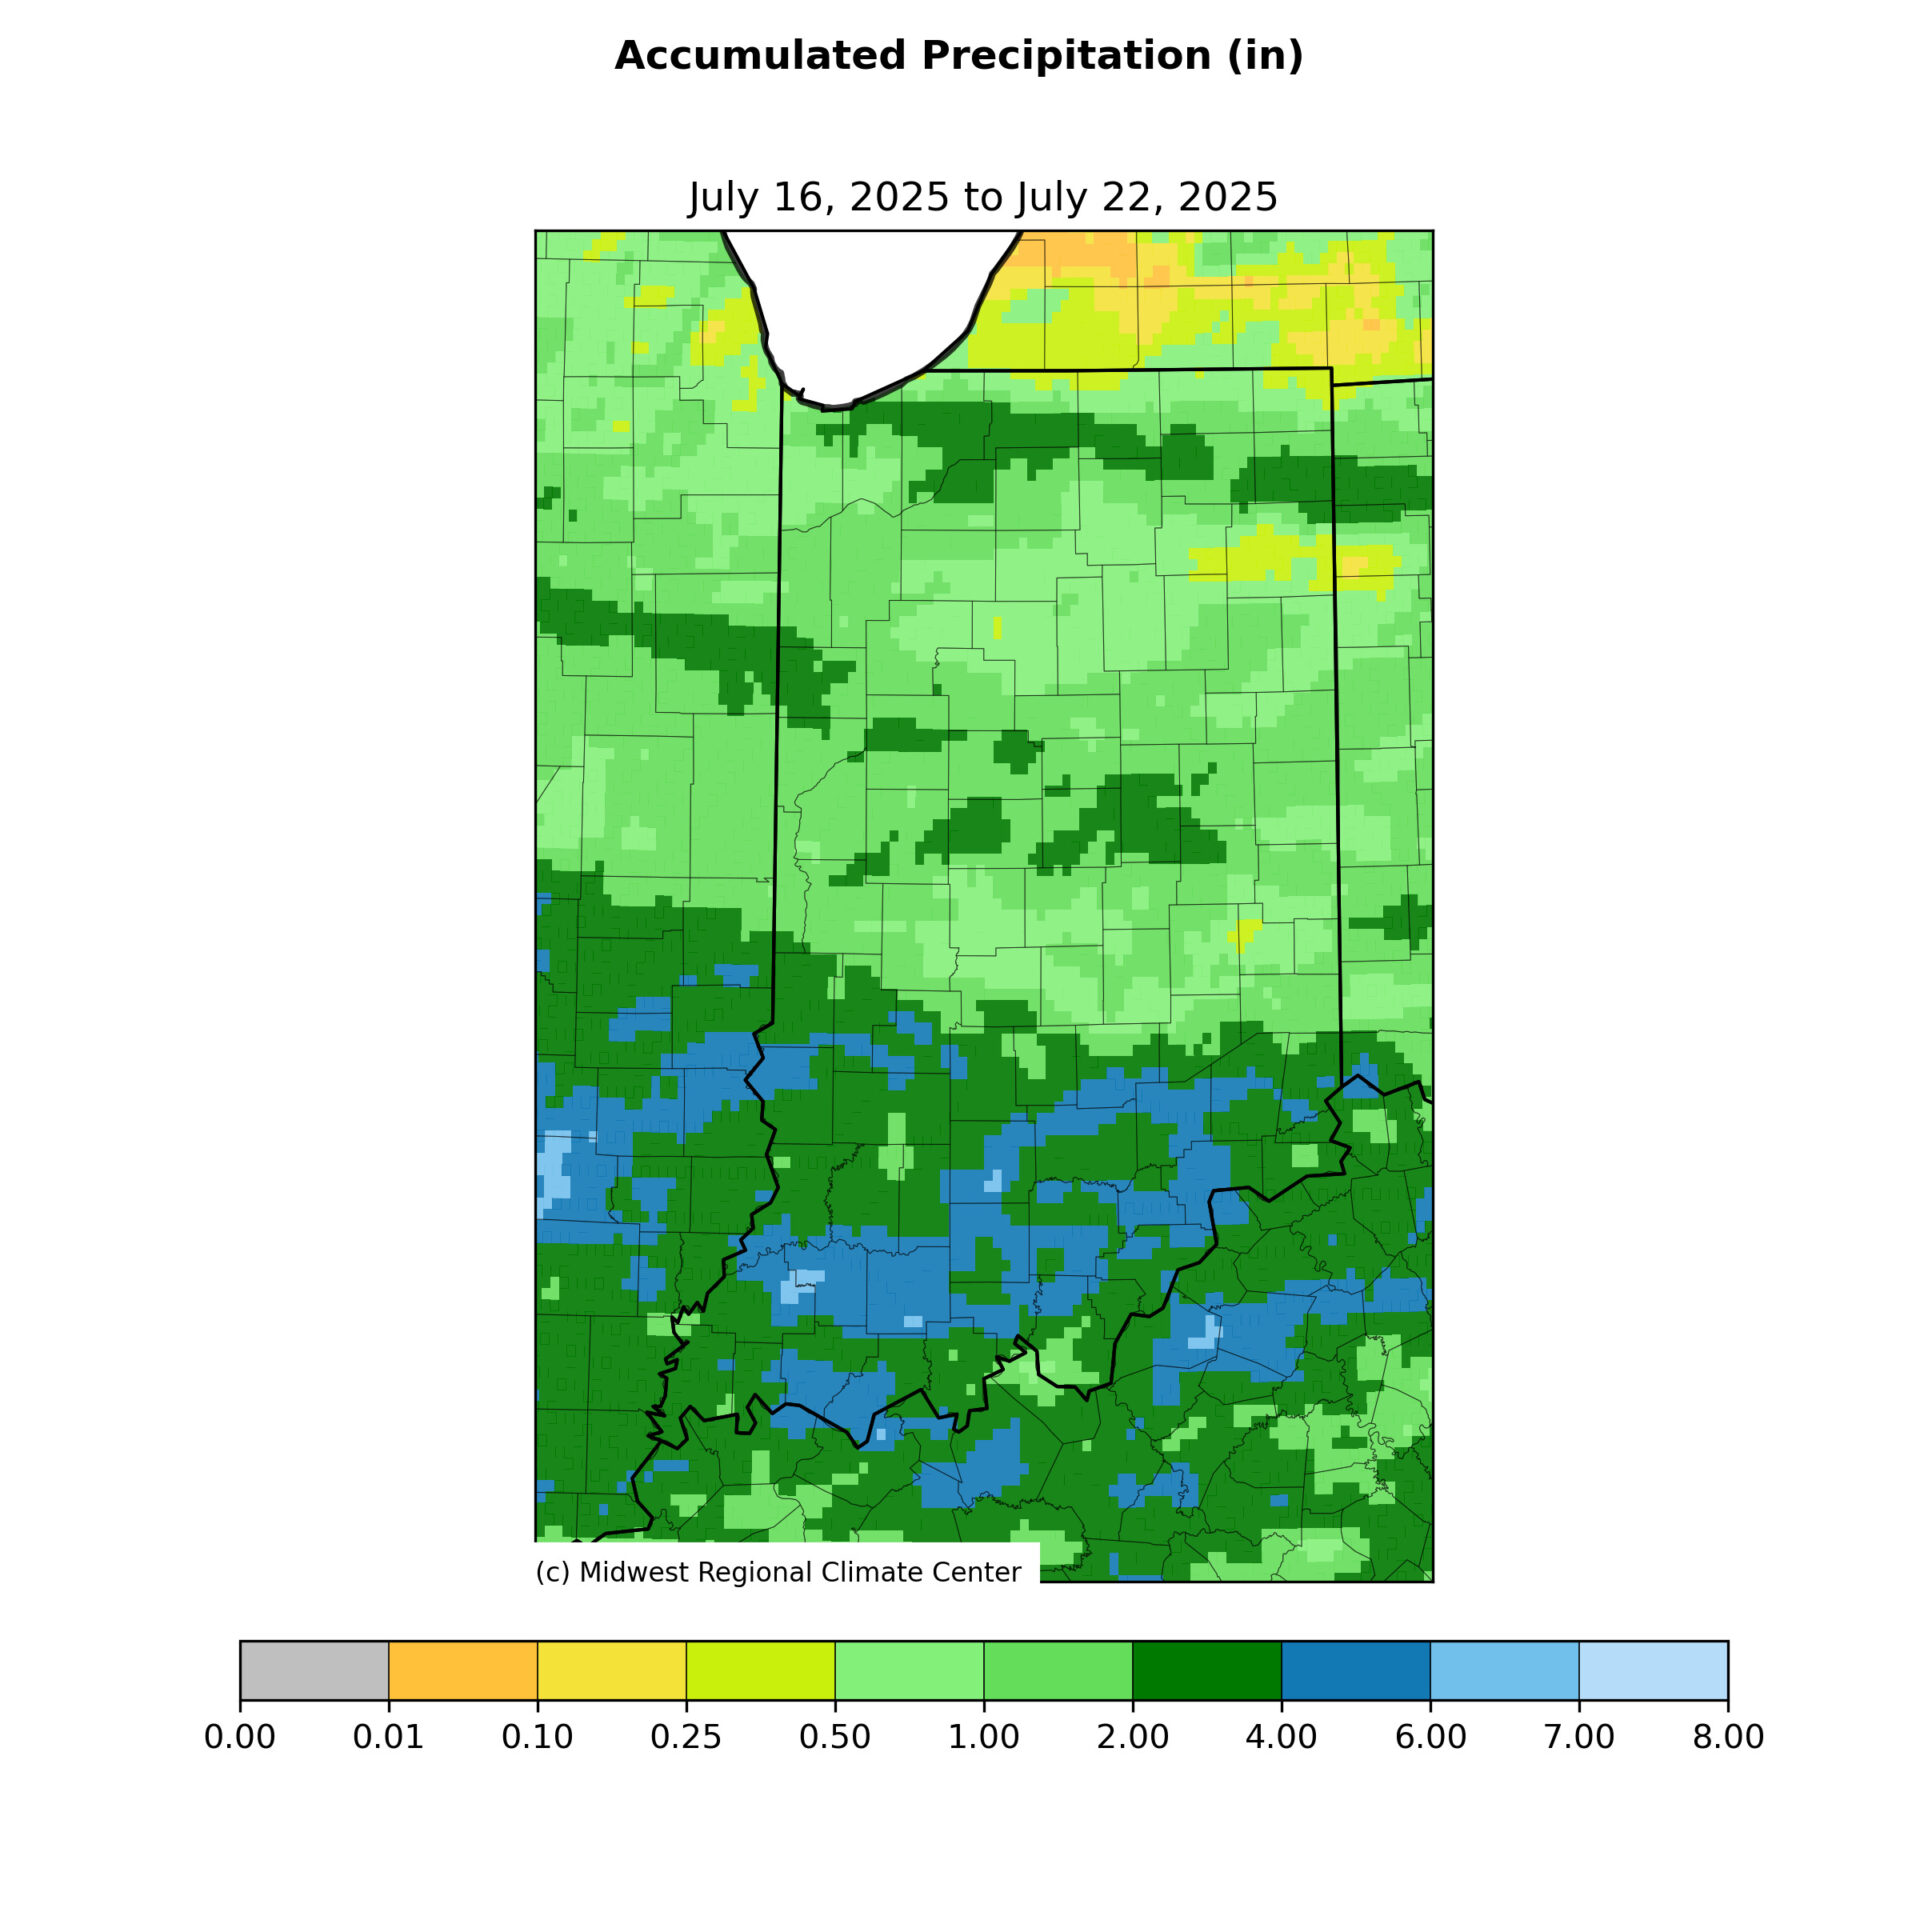
Figure 4. July 16-22 accumulated precipitation.
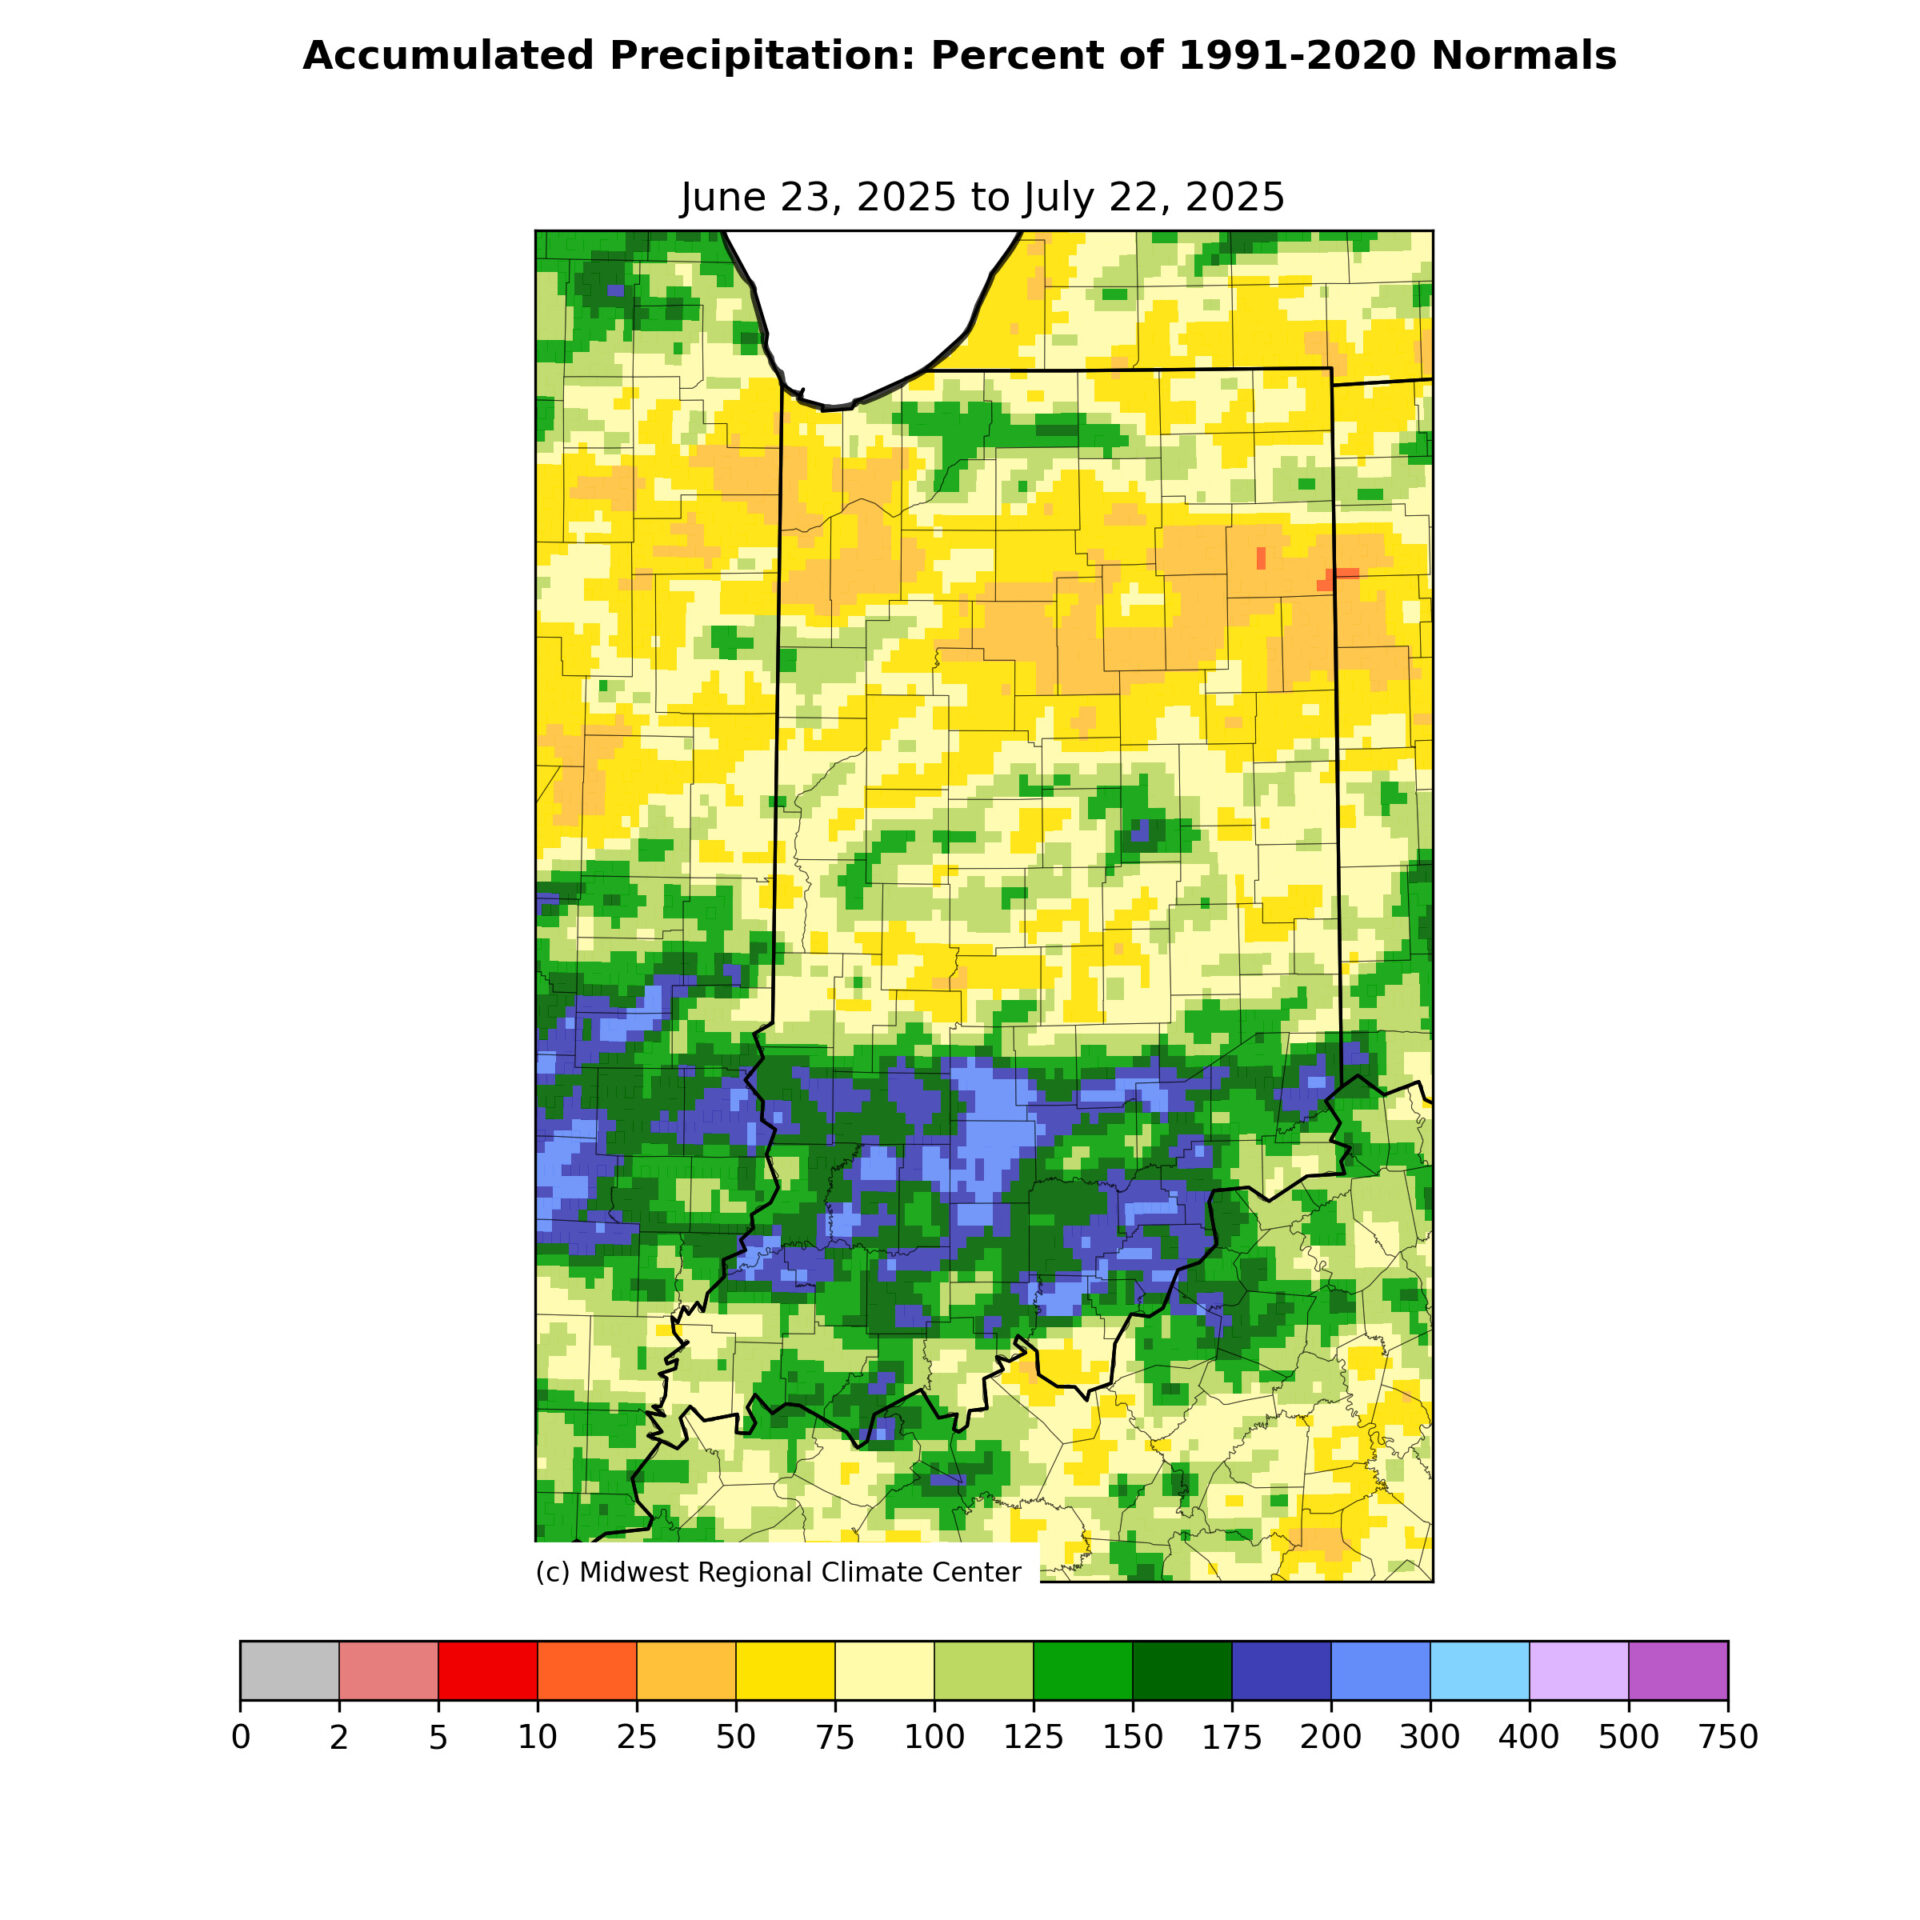
Figure 5. Accumulated precipitation from June 23 to July 22 shown as a percentage of the 1991-2020 normals.
How has the July 22 US Drought Monitor responded to recent rainfall totals? Southern Indiana is now free of Abnormally Dry (D0) conditions, but Moderate Drought (D1) has expanded into several counties in northern Indiana (Figure 6). Severe Drought (D2) has been added in far western Lake County this week. Not all areas in northern Indiana saw worsening conditions. Heavy rain improved conditions in St. Joseph, Elkhart, Noble, and DeKalb counties, which were previously under D0 conditions. Overall, about 15 percent of the state is experiencing drought conditions (D1 or D2), while nearly 16 percent is in D0 status.
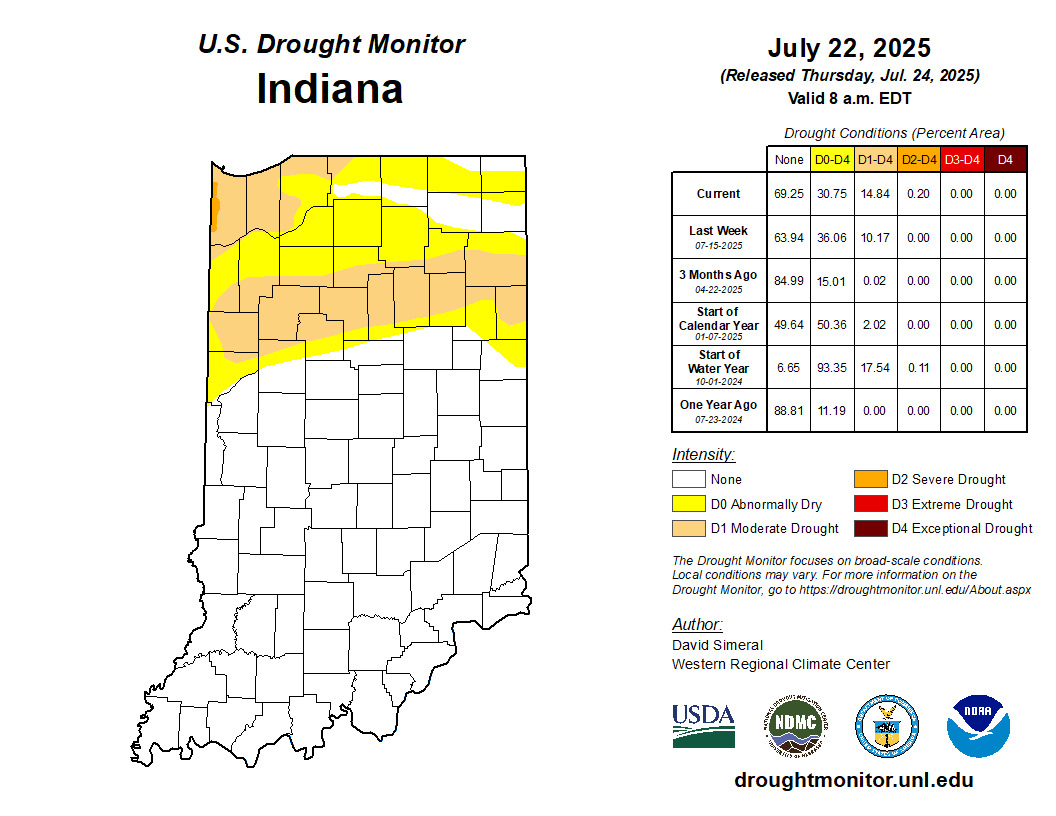
Figure 6. July 22, 2025, US Drought Monitor map
Regarding Modified Growing Degree Days (MGDD), these maps have also been updated to provide a clearer view of MGDD accumulations across the Midwest (Figure 7). Almost all of Indiana has experienced above-normal MGDD accumulations since May 1. Central Indiana, west and south of Indianapolis, is running 150-180 units above normal for the growing season as of July 22.
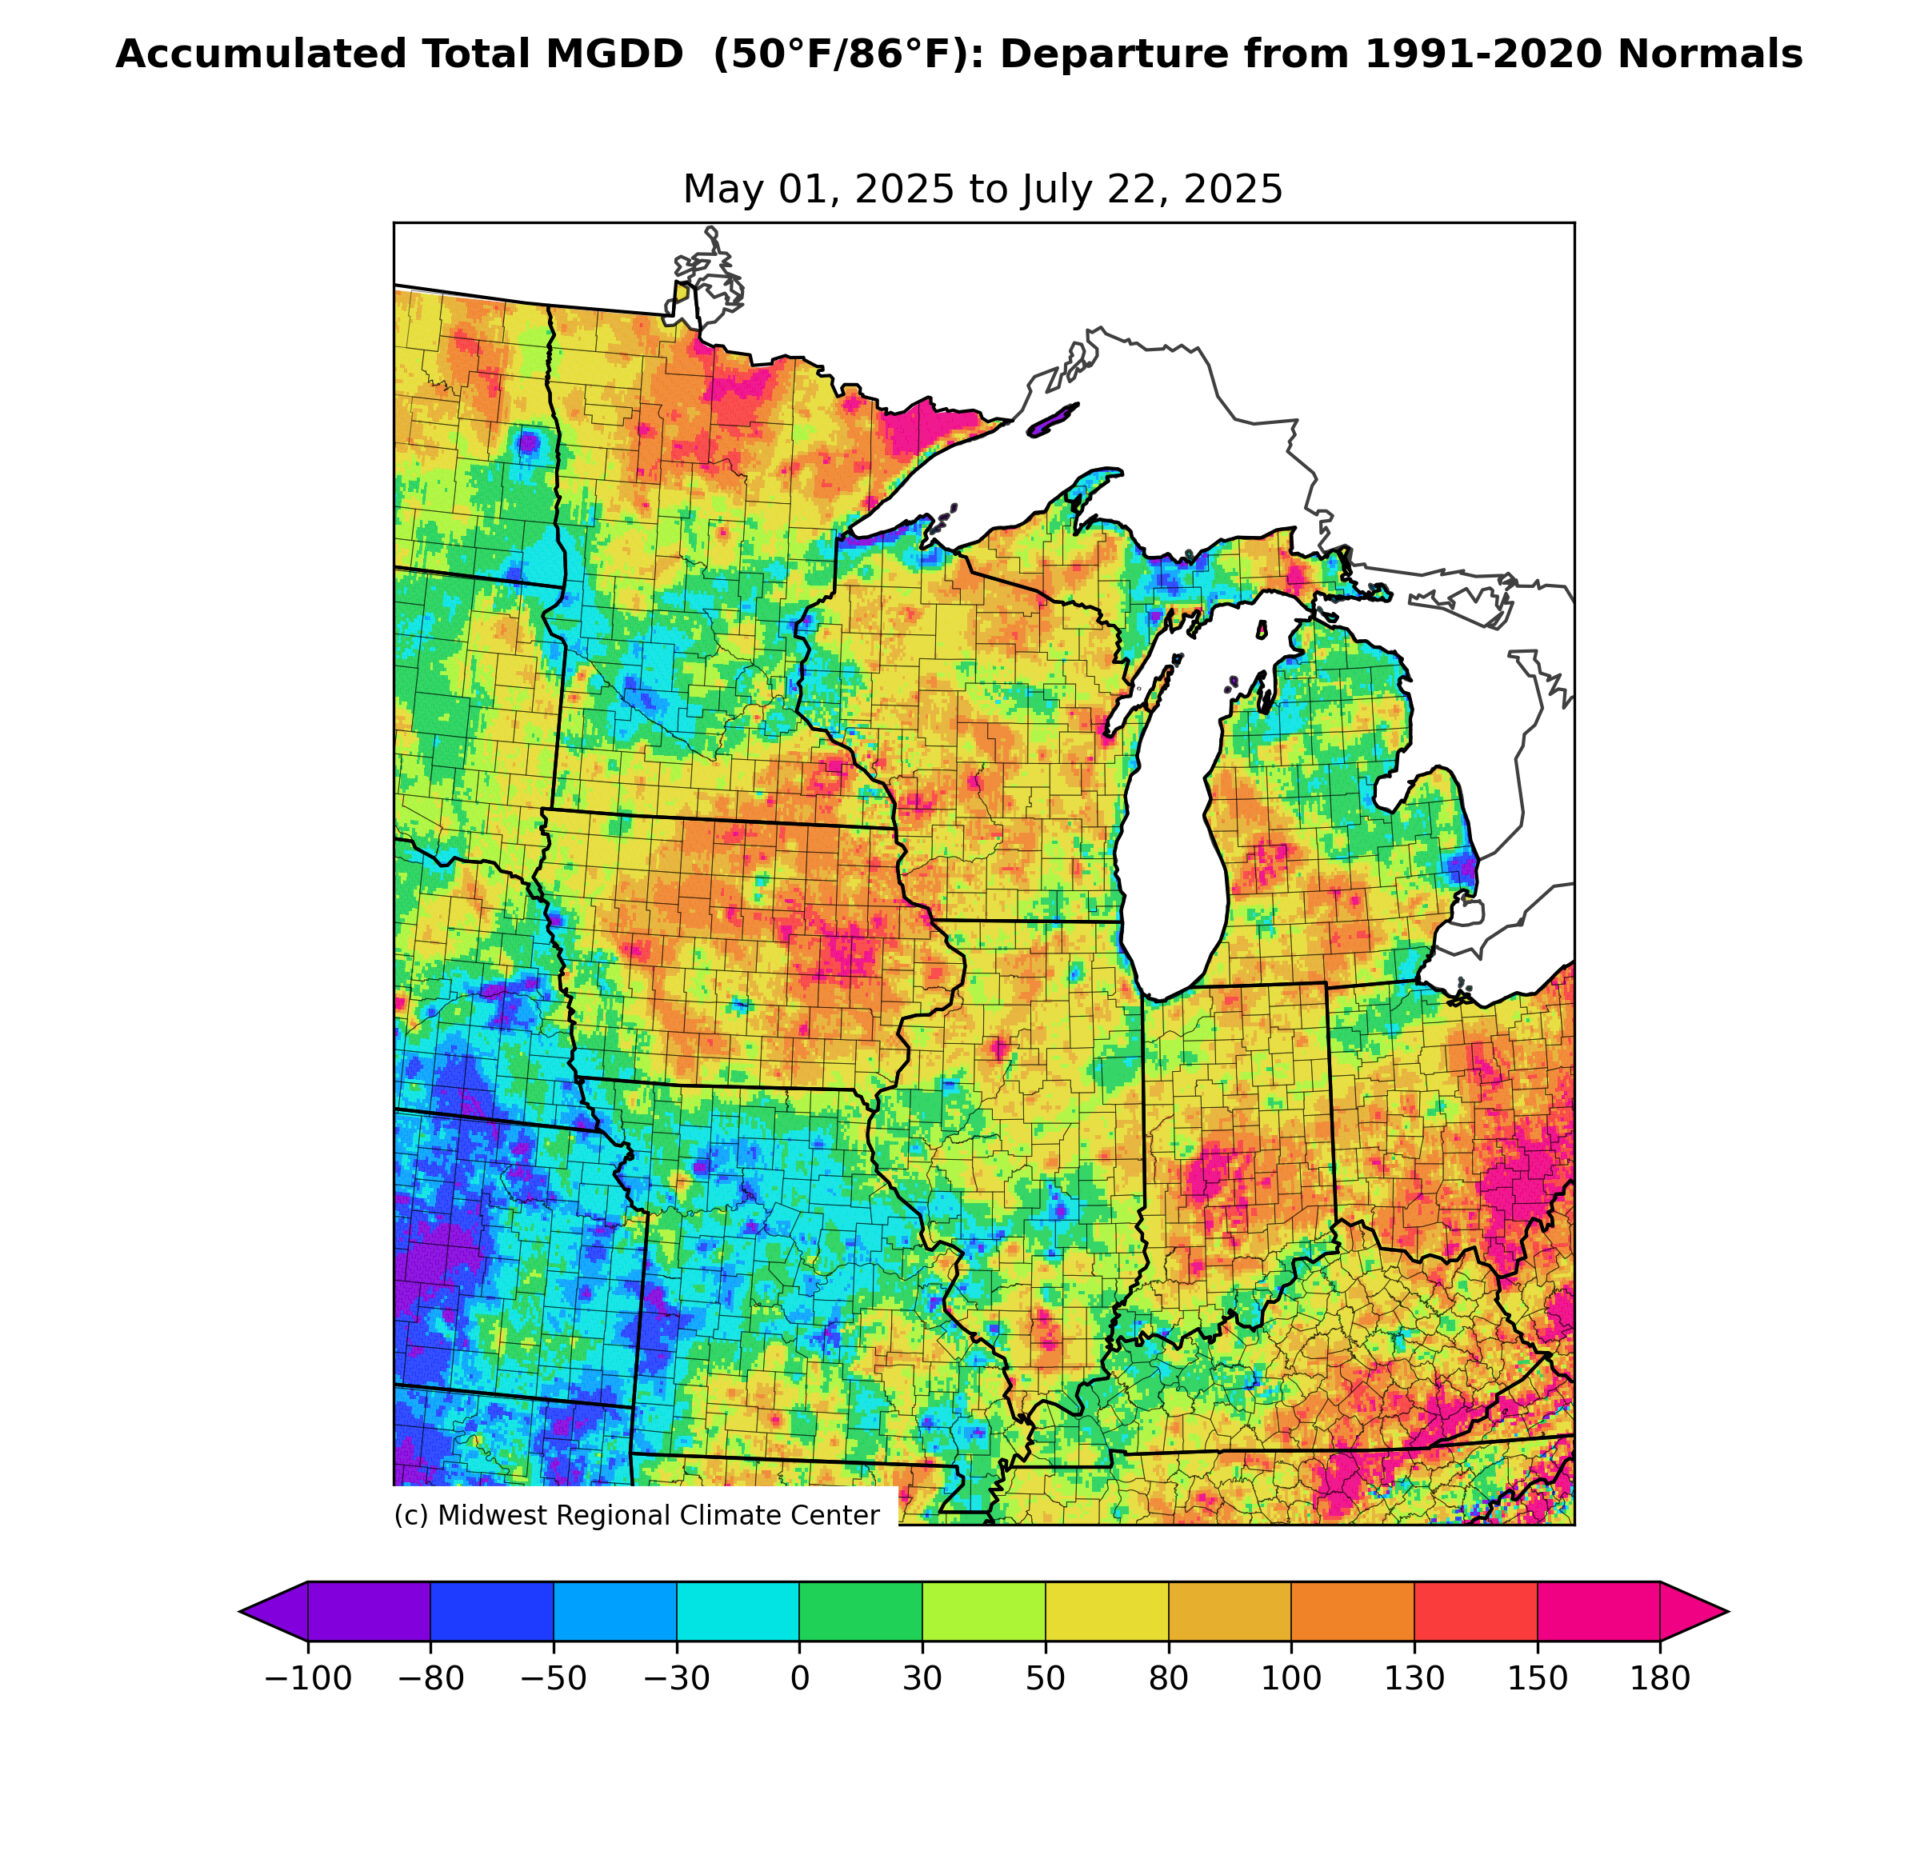
Figure 7. MGDD (base 50, ceiling 86F) accumulation for May 1 – July 22 represented as the departure from the 1991-2020 climatological normal.
So, what’s ahead in the coming weeks? The Climate Prediction Center indicates that near-to-above-normal temperatures and typical precipitation are likely to persist through the end of the month (Figure 8). However, a cooldown is expected in the first week of August, with below-normal temperatures and near-normal to below-normal precipitation expected (Figure 9).
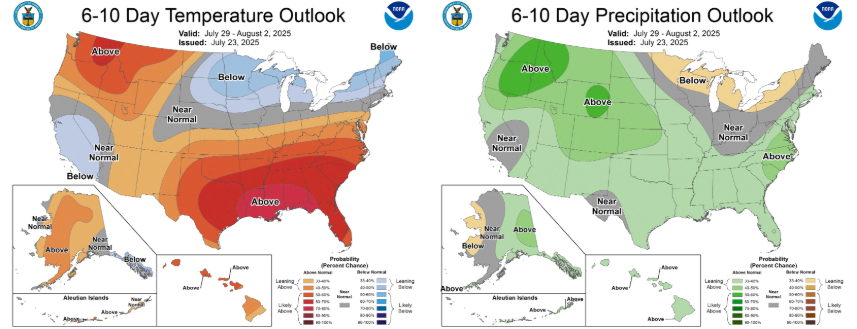
Figure 8. CPC 6-10 Day Temperature and Precipitation Outlooks, valid July 29-August 2, 2025.
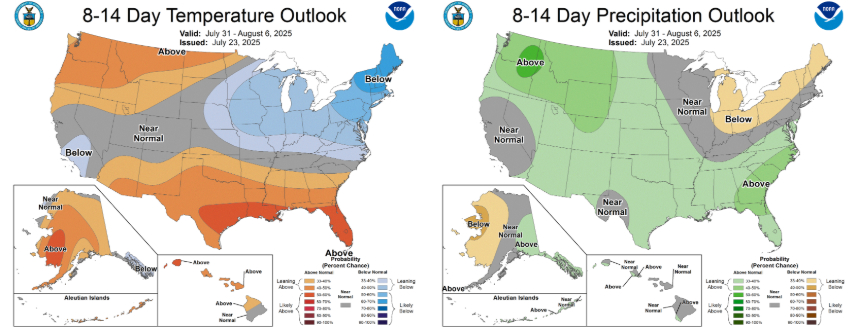
Figure 9. CPC 8-14 Day Temperature and Precipitation Outlooks, valid July 31-August 6, 2025.