The first week of May certainly didn’t feel like May, as temperatures were 5-10°F below normal across the state (Figure 1). Daytime maximum temperatures struggled to reach 60°F across the northern half of the state, while southern areas only saw low 60s for much of the week. Using Indianapolis as a reference point, given its location near the state’s geographic center, normal maximum temperatures should be near 70°F by May 7. Minimum temperatures ranged from the 30s in the far north to the low 40s across much of the rest of the state. The normal low temperature for Indianapolis by May 7 is 50°F. While some frost may have occurred across far northern parts of the state, minimum temperatures were still slightly too high to see widespread frost concerns, which is good news for gardeners.
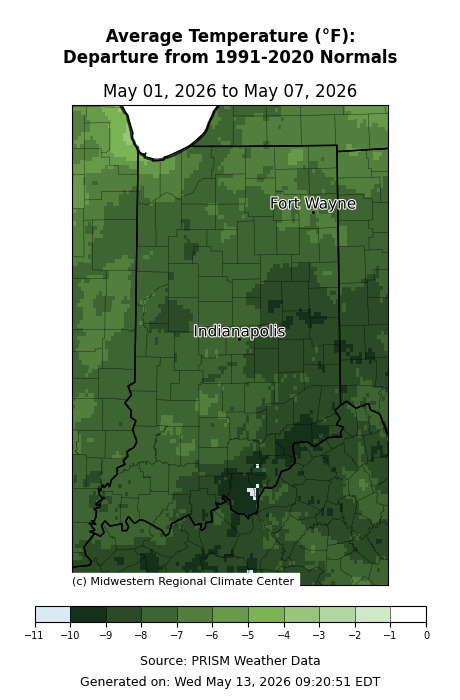
Figure 1. Departure from normal for average temperatures across Indiana. Southern and eastern parts of the state were nearly 10°F below normal for average temperatures for the first week of May.
There was a gradient in precipitation across the state. Much of the state, from the Hoosier Heartland Highway southward, observed normal to above normal precipitation. Some pockets observed over 200 percent of normal precipitation for the week (Figure 2). Despite this, precipitation was below normal across Northwest Indiana and the southwestern corner of the state in Posey County. Locations near Indianapolis and southward received 2-3 inches of precipitation during the week, while Northwest Indiana observed a maximum of 0.5-0.75 inches of precipitation for the week (Figure 3). Certain river gauges along the White River and Wabash River peaked at minor flood stage during the first few days of the month, though most have since returned to lower levels.
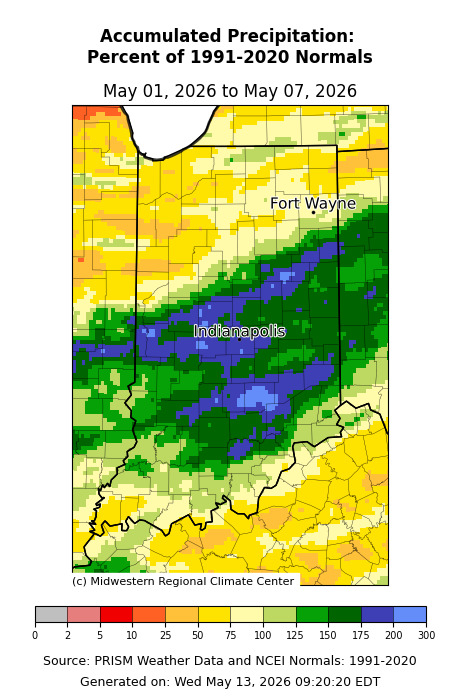
Figure 2. Percent of normal accumulated precipitation for Indiana for May 1-7. Precipitation was above normal across central and southern Indiana, and below normal to the north.
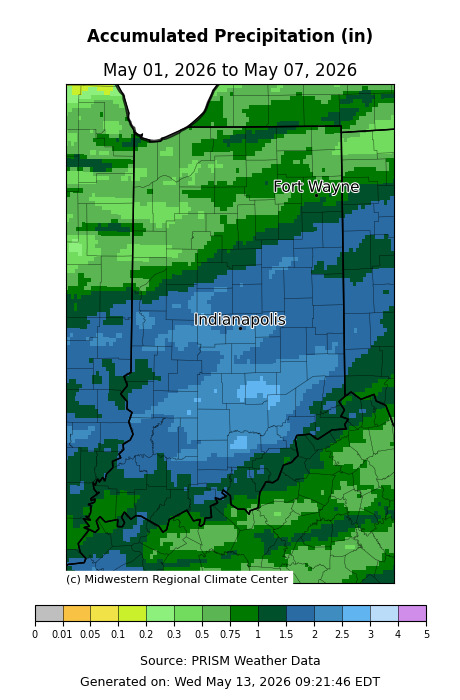
Figure 3. Accumulated precipitation for Indiana for May 1-7. Totals were highest from Indianapolis southward.
Precipitation in April did a good job of alleviating drought conditions. By May 5, there were only small areas of D0 (abnormally dry) and D1 (moderate drought) across the southern parts of the state along the Ohio River (Figure 4). Drought does not seem to be a concern heading through the rest of spring, as the National Weather Service’s Climate Prediction Center anticipates a likely chance of above normal precipitation through at least the rest of May. This is coupled with a pattern shift that has temperatures trending above normal through Memorial Day Weekend.
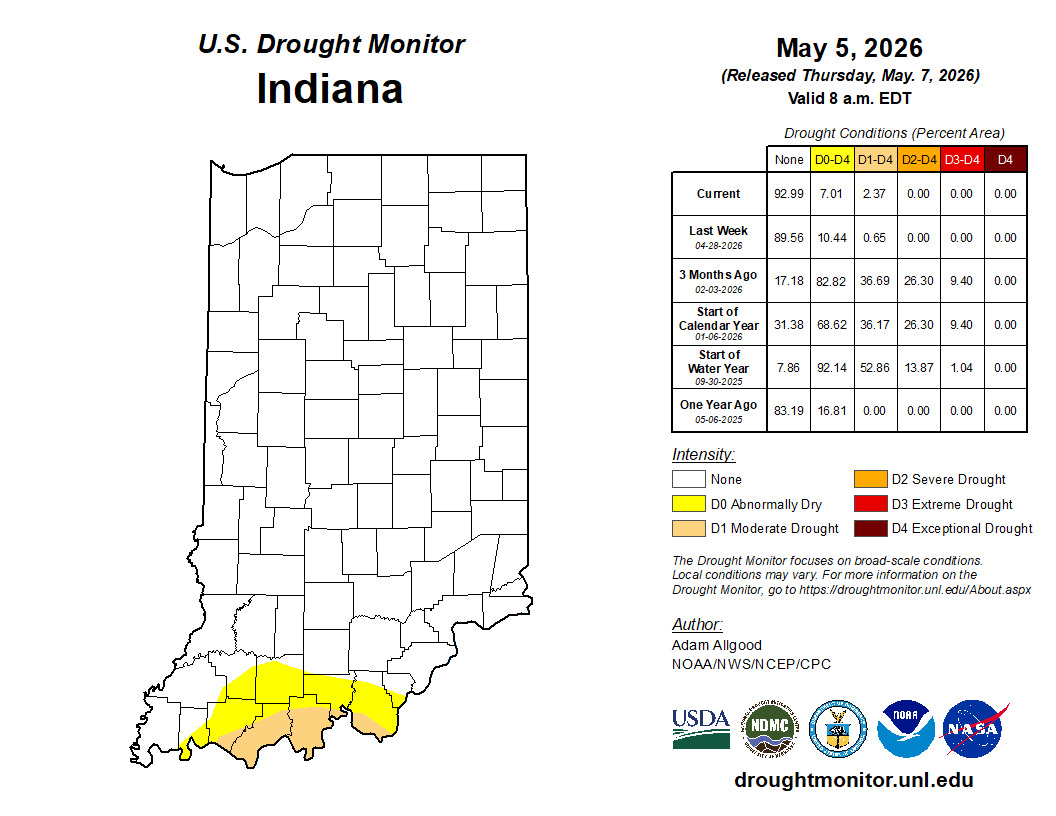
Figure 4. Drought monitor for Indiana as of May 5. Drought has improved greatly through the Spring, with the only drought conditions left in southern Indiana.