Precipitation in May has varied tremendously, but most of the state has generally been on the dry side. Areas from Vermillion and Parke Counties to Lake Michigan have received between 25% and 75% of the normal precipitation through May 27 (Figure 1). Conditions were dry enough that thunderstorm winds on May 16 prompted the National Weather Service Chicago Office to issue rare dust storm warnings for Benton, Newton, Jasper, Lake, and Porter Counties. Farmers in these counties were further ahead due to the drier conditions, which exposed emerged soybeans to severe damage and led to widespread replanting decisions. Southern Indiana also faces challenges due to the limited planting windows. The USDA National Agricultural Statistics Service Indiana Crop Weather Report on May 27 indicated that 76% of corn and 71% of soybeans have been planted, both nearly on schedule despite the challenges.
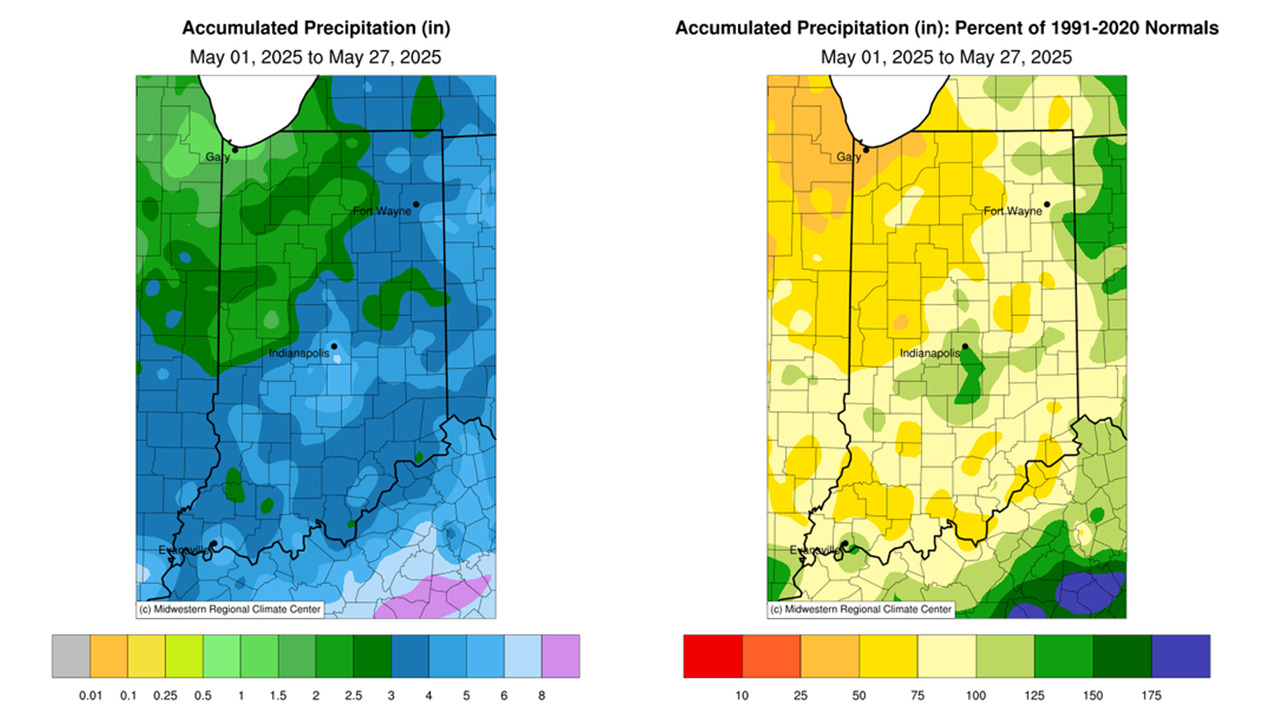
Figure 1. Left – May 1-27, 2025, accumulated precipitation represented as the departure from the 1991-2020 climatological normal. Right – May 1-27, 2025, accumulated precipitation represented as the percent of the 1991-2020 climatological normal.
Abnormally dry (D0) and moderate drought (D1) conditions are once again expanding across northern Indiana due to both short and long-term precipitation deficits. According to the US Drought Monitor on April 29, 2025, over 14% of the state was under D0 conditions. By May 27, 2025, the map reported that just over 32% of the state was experiencing either D0 or D1 conditions (Figure 2).
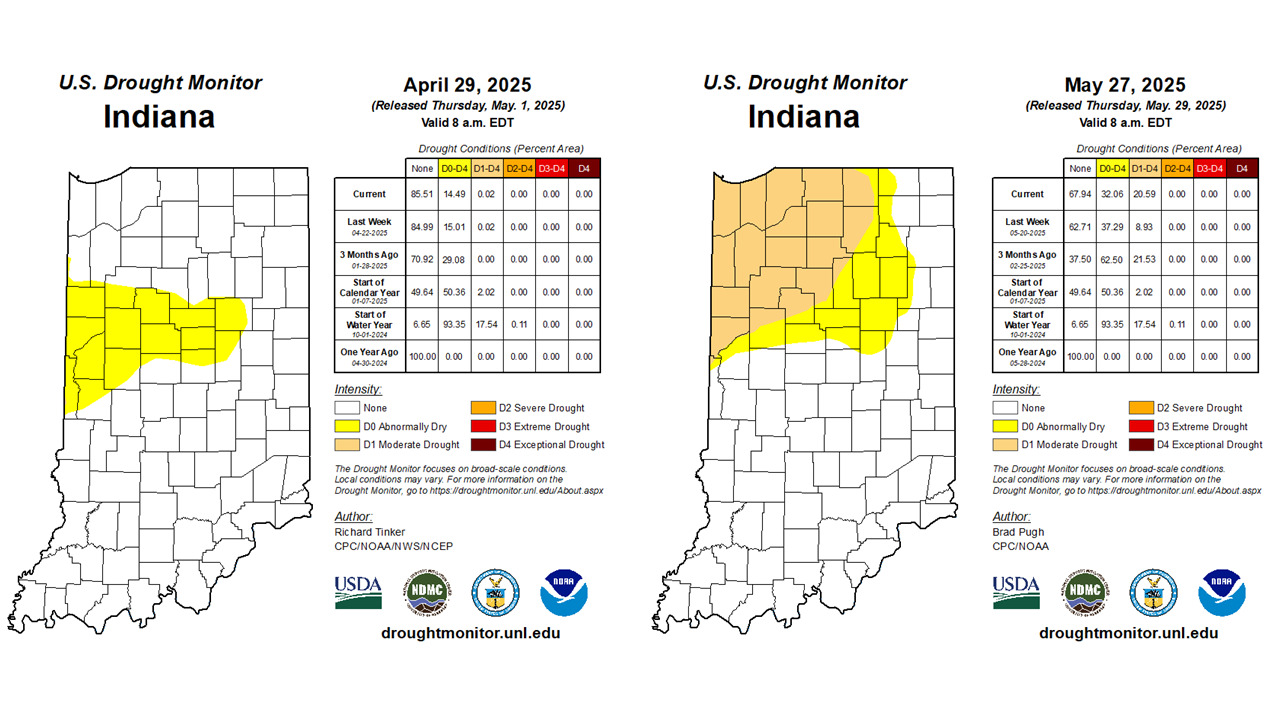
Figure 2: Left – April 29, 2025, US Drought Monitor Map. Right – May 27, 2025, US Drought Monitor Map.
Temperatures have been near or slightly below normal throughout the state, with the average for the state being 0.5°F below normal for the first 27 days of the month. In last week’s article, we discussed various GDD products and noted that these are purely temperature-driven. As a result, Modified Growing Degree Days since May 1 are between 20 and 40 units below normal (Figure 3).
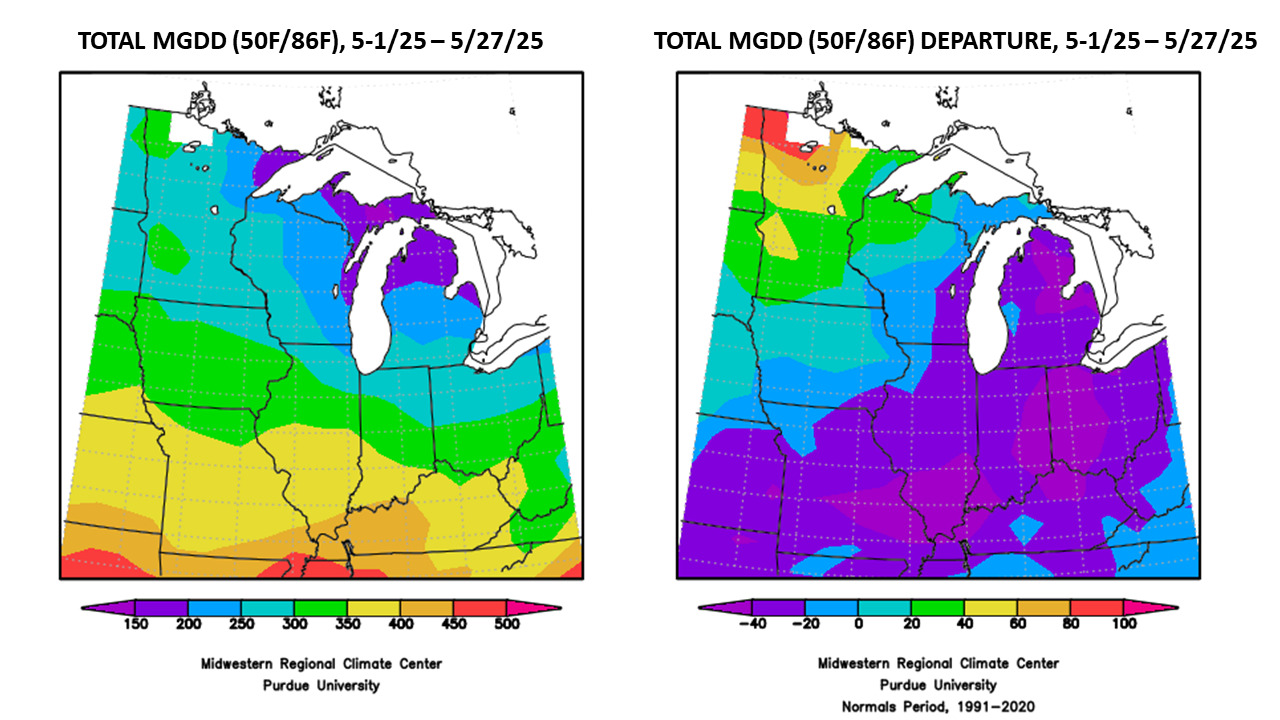
Figure 3: Left – Total MGDD (50°F/86°F) accumulation for May 1-27, 2025. Right – Total MGDD (50°F/86°F) accumulation displayed as the departure from the 1991-2020 climatological normal.
What can we expect for June? The Climate Prediction Center outlook indicates near-normal precipitation and above-normal temperatures for the first week of June (Figure 4). This trend of increased chances for above-normal rainfall and temperatures is likely to persist into the second week (Figure 5). Overall, CPC products indicate that the western half of the state is expected to experience above-normal temperatures, with equal chances for precipitation. In contrast, the eastern half is expected to see above-normal rainfall.
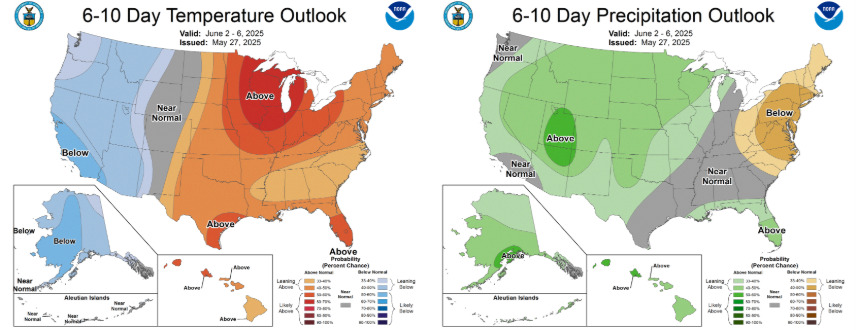
Figure 4: CPC 6-10 Day temperature and precipitation outlook maps, valid June 2-6, 2025.
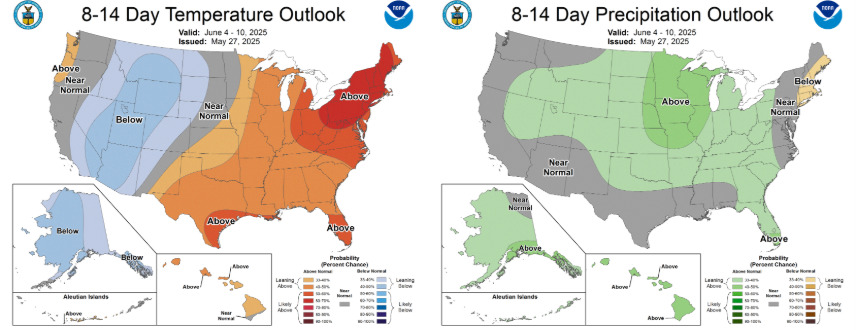
Figure 5: CPC 8-14 Day temperature and precipitation outlooks, valid June 4-10, 2025.