High winds can cause serious damage to high tunnels and greenhouses. Design and construction with this in mind is important to reduce risk. In this article the topic is day to day risk management for a structure that is already constructed. When strong winds threaten, closing up the endwalls and sidewalls can help reduce risk. As I heard a greenhouse engineer explain, the plastic greenhouse acts like an airplane wing: when wind rushes through the structure it creates a lift that works to pull the ground posts up and out of the ground, or rip plastic. When doors and sidewalls are closed, wind moves over the top of the structure instead of through it, and the lifting does not occur.
The decision about when to close down a tunnel due to wind will vary for each operation. For some operations, decisions can be made on a moment-to-moment basis because people are always around and available to do the work. For others, decisions have to be made in advance, because people are away for hours or days. A good prediction for when damaging winds might occur is a useful tool.
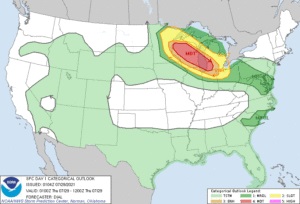
I want to share a website for prediction that I have found helpful for deciding when to close down high tunnels at the Pinney Purdue Ag Center. It is the Convective Outlook https://www.spc.noaa.gov/products/outlook/day1otlk.html from the National Weather Service Storm Prediction Center. The Center also posts regularly on their Twitter account @NWSSPC. The website provides a map with color-coded overlays representing the likelihood of severe weather associated with thunderstorms. There are separate maps for 1-day, 2-days, 3-days, and 4 to 8 days out. For the 1-day and 2-day predictions, separate maps are available for overall thunderstorm risk, tornado, wind and hail. Explanation of the color codes is provided at https://www.spc.noaa.gov/misc/about.html#Convective.
For example, a slight chance for severe wind indicated by yellow shading indicates a 15% probability of wind greater than 58 mph. A slight change of severe thunderstorm indicated by yellow indicates a similar probability of organized severe storms that aren’t widespread with varying intensity. The map below from last July shows a slight to enhanced risk for northwest Indiana. We closed down the high tunnel endwalls and sidewalls overnight during that period.
Are there other resources you use to help make decisions about managing tunnels to present wind damage? Please drop me a note if you’d like to share them.

July 29, 2021 Day 1 Convective Outlook from National Weather Service Storm Prediction Center. https://www.spc.noaa.gov/products/outlook/archive/2021/day1otlk_20210729_0100.html