After the brutal heatwave hit us as June transitioned to July, any future above-normal temperatures may seem normal for this time of year. The National Climate Prediction Center is indeed favoring more above-normal temperatures throughout the middle of July, so hopefully you have started acclimating to Indiana summers! The key is to hope humidity stays relatively low so that those warmer temperatures stay tolerable. There is a slight risk of another extreme heat event impacting Indiana around July 16-20, but for now, the higher risks remain to our west.
In the meantime, more precipitation is on its way for this coming weekend (Figure 1). The greatest amounts (> 2”) are favored for the southern half of Indiana, but even northern counties should see at least 0.25” up to 1.25” by the end of the weekend. Since these rain events have been occurring every few days, drought has not yet returned to our state. Unfortunately, the area that may need it most to stay drought-free is northeastern Indiana – where little rain is expected. Over the past 30 days, northeastern and eastern Indiana have seen only about 75% of what they would have historically during the same period (Figure 2). To be one of the factors supporting the downgrading of this region to Abnormally Dry (i.e., category D0 of the U.S. Drought Monitor), precipitation deficits should be below the 30th percentile of normal across multiple time periods (e.g., the past 30, 60, or 90 days).
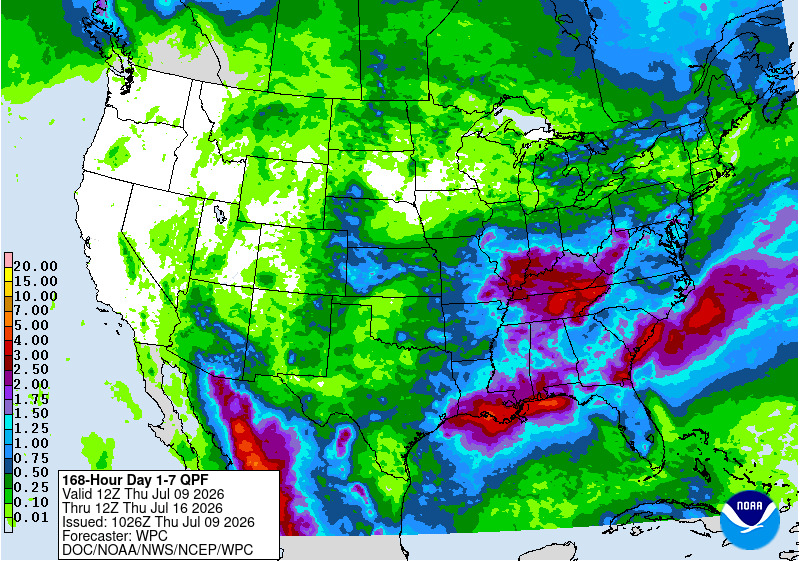
Figure 1. Forecasted 7-day precipitation totals for July 9-16, 2026.
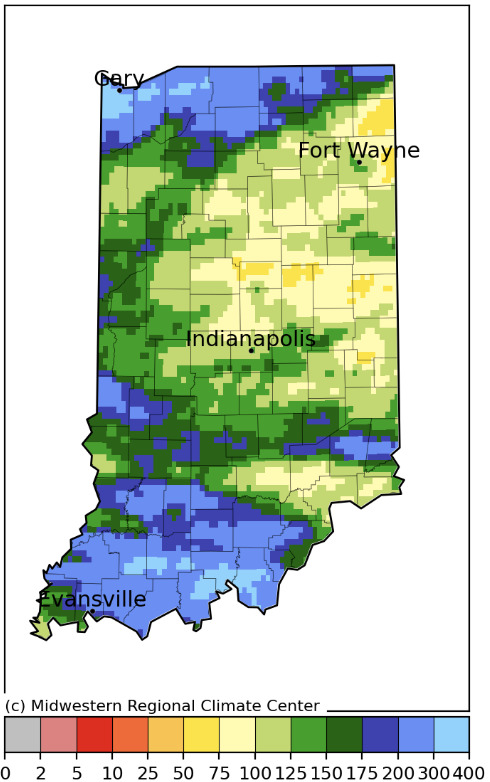
Figure 2. Accumulated precipitation presented as the percent of what normally fell during the period June 9 to July 8 for the years 1991-2020.
Modified growing degree-day accumulations and departures since April 15 are slightly above normal (Figure 3), with most locations 3-4 days ahead of the 1991-2020 average (Figure 4). Southern Indiana is a bit further ahead than that (e.g., 5-6 days). As temperatures remain warmer than normal, accumulations are unlikely to slow, especially if daily high temperatures stay in the mid-80s.
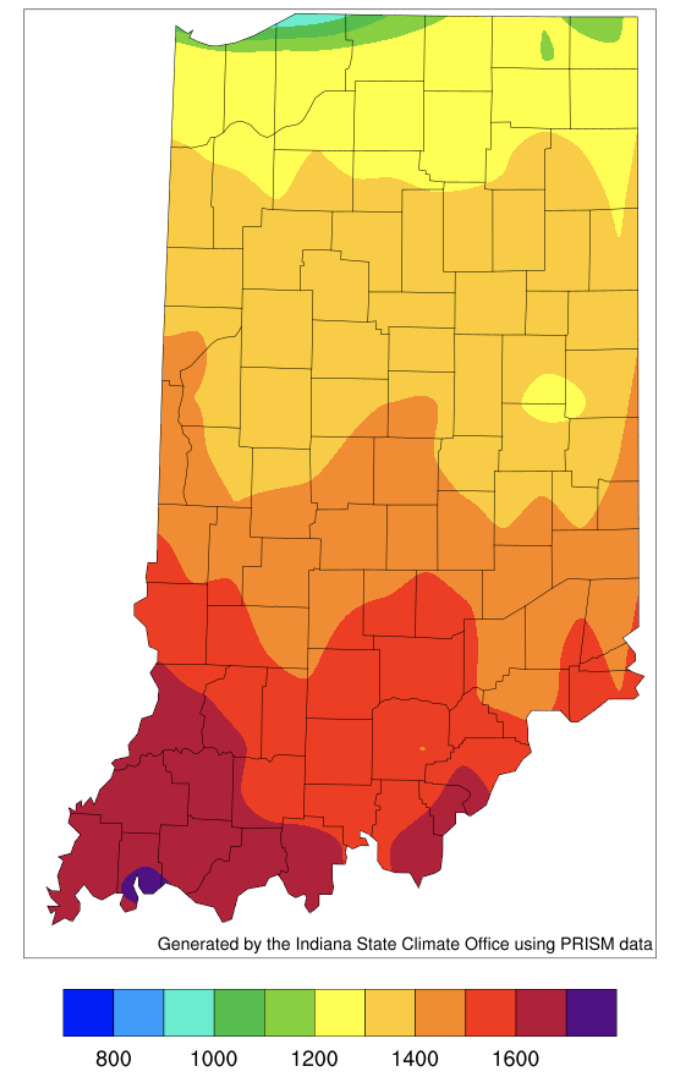
Figure 3. Accumulated modified (50°F/86°F) growing degree days from April 15 through July 7, 2026.
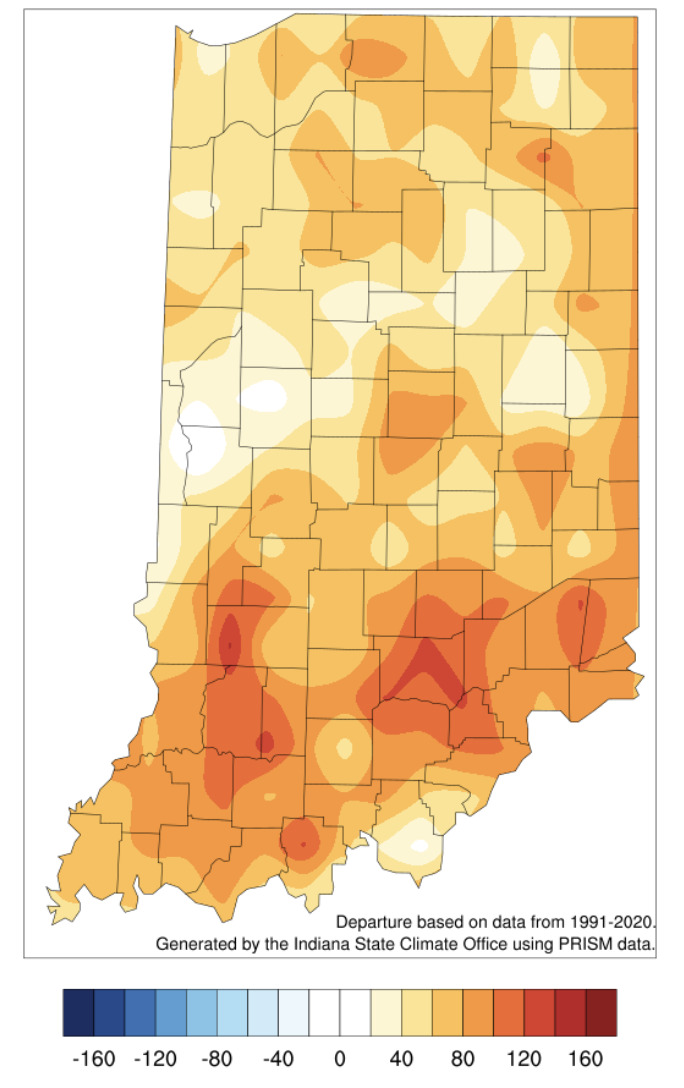
Figure 4. Accumulated modified (50°F/86°F) growing degree days from April 15 through July 7, 2026, presented as the departure from the 1991-2020 average.