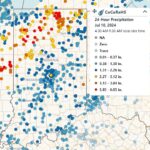
The remnants of Hurricane Beryl brought much-needed rain to the state, although some areas experienced excessive totals. In addition, sporadic power outages were reported as a result of wind gusts exceeding 30 mph. The Community Collaborative Rain, Hail, and Snow (CoCoRaHS) volunteer network once again proved essential, with observations ranging from just under 0.4 inches…Read more about Remnants of Hurricane Beryl Bring Relief and Challenges to Indiana[Read More]
Austin Pearson

County Extension Director, Extension Educator Agriculture and Natural Resources
Tipton County
Tipton County

Allergy season is in full swing. At least, it is for me. Runny nose, itchy eyes, and consistent drainage that I have to clear in the shower every morning. We love spring, right?? That’s enough complaining for now. Indiana’s April 2024 average temperature was 55.1°F (3°F above normal), which was good enough for the 14th…Read more about Warm Temperatures and Rain Continues[Read More]
It’s gonna be… I mean… it’s already May! How can this be? Early spring flowers have already cycled through, I’m on record pace for mowing my yard, and field activity has been delayed due to a wet April. April began a bit cool, with several mornings of frost advisories and freeze warnings, which was not…Read more about April Ends Warm and Wet[Read More]
Have you ever heard of the song by Glenn Frey, “The Heat Is On”? No pun intended, but the heat is certainly on! Heat index values over 110F have made things sticky and oppressive across the state. As I drove into work on Thursday morning, the humidity was so high that I had to defrost…Read more about The Heat and Humidity Is On, But Will It Last?[Read More]
Timely rains have returned over the past few weeks and have helped crop conditions across the state. Now that we are entering critical corn and soybean growth stages, cooler temperatures and rain are certainly welcome. Although rains have returned, they continue to be inconsistent. Vigo, Sullivan, and Lawrence counties had locations receiving more than 8…Read more about Drought Conditions Continue to Improve. Will this Continue?[Read More]

Temperatures warmed into the 80s by the end of Memorial Day weekend, but low dew point temperatures made the heat bearable. The air felt dry, and any time I would stand up from my lawn chair, I would be shocked by static electricity. The state average temperature between May 1 and May 30 was 62.3F,…Read more about Dry Conditions Continue, Drought Conditions Expected to Worsen[Read More]
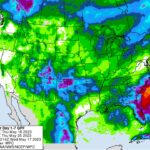
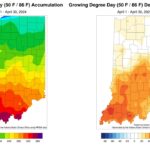
Cool mornings and warm afternoons have made conditions pleasant across the state. Through the first 17 days of May, temperatures ran 1.5◦F above normal (Figure 1). Indiana Climate Divisions 1 and 7 had the largest departures, which were 2.1◦F and 2.0◦F above normal, respectively. Since April 1, growing degree days (GDD) have accumulated between 260…Read more about Recent Localized Rainfall; Warm Temperatures and Below-normal Precipitation Forecasted[Read More]
It is May, the sun is shining, of course the wind is blowing, and the weather forecast is calling for warmer temperatures. Things are looking up from here. Despite the warm start and cool end to April, the preliminary statewide average temperature ran 1.2°F above normal (Figure 1). The largest temperature departures occurred in northern…Read more about Warmer Temperatures on the Way[Read More]
Through the first 18 days of April, temperatures ran 5.5◦F above normal statewide (Figure 1). The largest deviations occurred in central and northern Indiana. Despite the wet start to the month, wind, abundant sun, low humidity and reduced precipitation accounted for drying conditions across the state. Statewide, precipitation averaged 69 percent of normal. Surprisingly, tillage,…Read more about Return to Below-Normal Precipitation, Variable Temperatures, and Enhanced Freeze Risk[Read More]

Indiana experienced near-normal temperatures for March as the state averaged 40.9◦F, despite the record warmth at the beginning of the month (Figure 1). Weather stations in central, southern, and eastern Indiana experienced record-breaking high temperatures during the first week of March (Figure 2). Cold weather returned during the third week, with several daily low maximum…Read more about Stormy End to March, Elevated Chances for Above-Normal Temperatures through Mid-April[Read More]