A potentially historic El Niño is developing in the tropical Pacific as we head toward winter 2026–27. You may have heard the term “super El Niño” used to describe it. NOAA’s October 8 outlook gives a combined 97 percent chance of a strong or very strong El Niño during winter (December–February). These strength categories are based on the three-month Relative Oceanic Niño Index (RONI), which measures central tropical Pacific warming relative to the broader tropical oceans. Weak events have RONI values of +0.5–0.9°C, moderate events +1.0–1.4°C, strong events +1.5–1.9°C, and very strong events +2.0°C or higher. Eight winters have reached a strong or very strong categorization since records began in 1950. El Niño’s warm Pacific waters can influence the jet stream and winter storm tracks, usually meaning warmer and somewhat drier winters in Indiana.
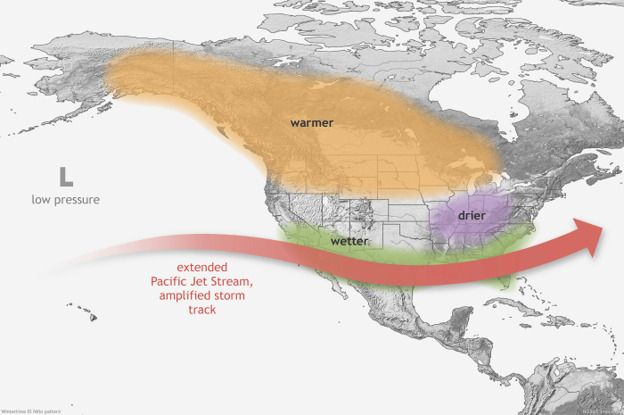
Figure 1. El Niño winter pattern. Source: climate.gov.
We analyzed eight winters (December – February) since 1950 with RONI values of at least +1.5°C, representing strong or very strong El Niño conditions. We compared weather records for South Bend, Fort Wayne, Indianapolis, and Evansville with each area’s 1991–2020 climate normals and used medians (middle values) to summarize the results.
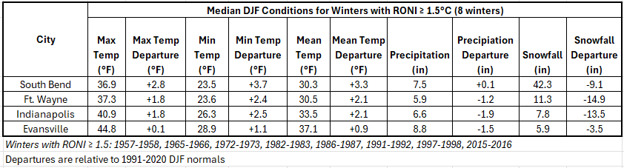
Figure 2. Median winter temperature, precipitation, and snowfall departures during the eight strong and very strong El Niño winters, compared with each area’s 1991–2020 normals.
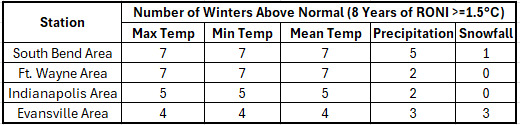
Figure 3. Number of the eight winters with above-normal temperatures, precipitation, or snowfall.
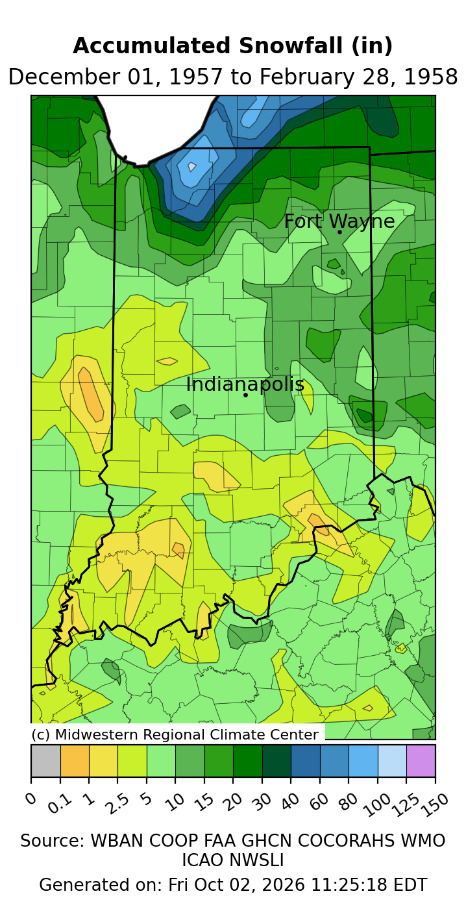
South Bend had the clearest tendency toward warmth. Seven of the eight winters were warmer than normal, and the median temperature was 3.3°F above normal. Precipitation was close to normal, while median snowfall was 9.1 inches below normal. One winter stood out: 1957–1958 brought 72 inches of snow, the only above-normal snowfall total in the group. A strong lake-effect snow signal can be seen in that winter, as indicated in the winter 1957-58 accumulated snowfall map.
Fort Wayne also had seven warmer-than-normal winters, with a median temperature of 2.1°F above normal. Snowfall showed the largest shortfall of the four locations: a median of just 11.3 inches, or 14.9 inches below normal. None of the eight winters had above-normal snowfall. Median precipitation was 1.2 inches below normal.
Indianapolis was warmer than normal in five of the eight winters. The median temperature was also 2.1°F above normal, but median snowfall was 13.5 inches below normal. None of the winters had above-normal snowfall. Median precipitation was 1.9 inches below normal, the largest deficit among the four locations. Only two winters were wetter than normal.
Evansville’s results were more mixed. Four winters were warmer than normal, with a median temperature of 0.9°F above normal. Median snowfall was 3.5 inches below normal, although three winters had above-normal snow. Median precipitation was 1.5 inches below normal.
Accounting for long-term trends
Because these winters span several decades, we also adjusted the data for long-term climate trends. The findings changed little. Adjusted median temperatures were 1.4–3.7°F above normal, and snowfall was 4.0–13.2 inches below normal. After adjustment, all eight winters were warmer than normal at South Bend and Fort Wayne. South Bend still showed the most warmth, while Fort Wayne and Indianapolis had the largest snowfall deficits. Precipitation remained near normal at South Bend and below normal elsewhere. At all four locations, average lows showed larger warm departures than average highs.
Summary
These eight winters generally brought milder temperatures and less snow to the four Indiana locations. Warmth was most consistent at South Bend and Fort Wayne, while Fort Wayne and Indianapolis had the largest snowfall deficits. Precipitation was near normal at South Bend and generally below normal elsewhere.
A similar winter in 2026–27 would fit that history, but eight winters are a small sample. South Bend’s 72-inch season shows how much snowfall can vary, especially if lake-effect snowfall increases. Other weather patterns will influence storm tracks and cold spells, so even a mild winter can still bring bitter cold and major snowstorms.
Methodology
Only eight December–February winters since 1950 have had a RONI of at least +1.5°C, the threshold for strong or very strong El Niño conditions, in the Climate Prediction Center’s historical record. We examined all eight: 1957–58 (+1.9°C), 1965–66 (+1.5°C), 1972–73 (+1.7°C), 1982–83 (+2.4°C), 1986–87 (+1.5°C), 1991–92 (+2.1°C), 1997–98 (+2.1°C), and 2015–16 (+2.1°C). The analysis used long weather records for South Bend, Fort Wayne, Indianapolis, and Evansville. These ThreadEx records combine observations from nearby sites as observing locations change. We compared each winter with each area’s 1991–2020 climate normals, or 30-year averages. We used medians to summarize the results and reduce the influence of extreme winters. For the trend-adjusted results, we estimated linear trends for each variable and location over 1950-2026 and adjusted values to the midpoint of the 1991-2020 normal period.